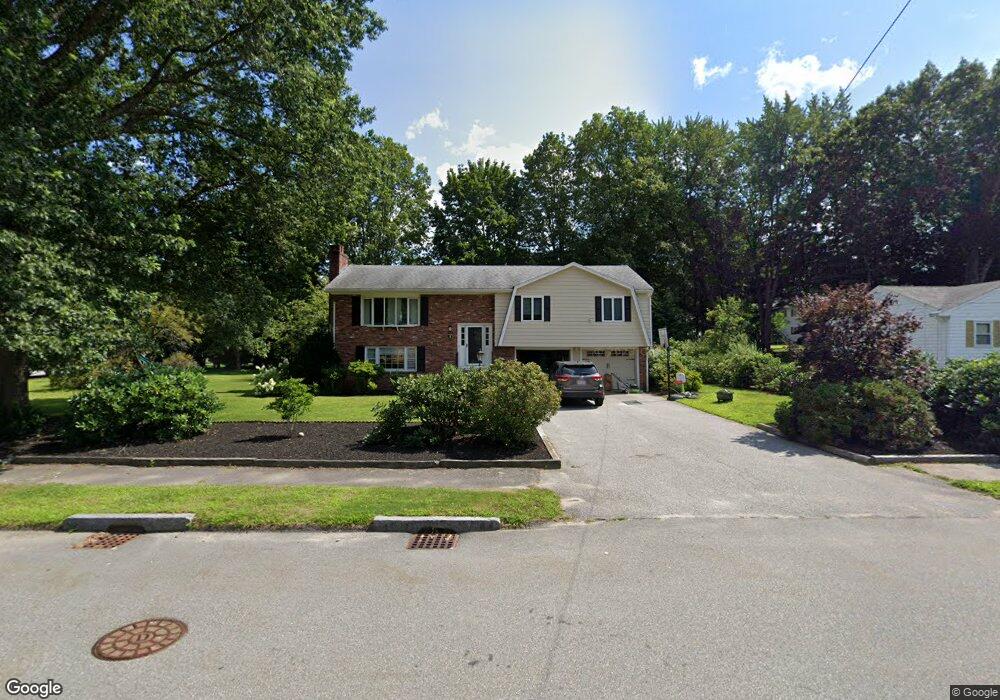
75 Spruce Rd Reading, MA 01867
Estimated Value: $895,000 - $959,000
4
Beds
3
Baths
1,902
Sq Ft
$485/Sq Ft
Est. Value
About This Home
This home is located at 75 Spruce Rd, Reading, MA 01867 and is currently estimated at $922,509, approximately $485 per square foot. 75 Spruce Rd is a home located in Middlesex County with nearby schools including Birch Meadow Elementary School, Arthur W. Coolidge Middle School, and Reading Memorial High School.
Ownership History
Date
Name
Owned For
Owner Type
Purchase Details
Closed on
Mar 1, 2023
Sold by
Carney Robert A and Carney Jarra N
Bought by
Robert A Carney Jr Lt and Carney
Current Estimated Value
Purchase Details
Closed on
Nov 4, 2016
Sold by
Testamentary T T and Testamentary Geller
Bought by
Carney Robert A and Carney Jarra N
Home Financials for this Owner
Home Financials are based on the most recent Mortgage that was taken out on this home.
Original Mortgage
$376,000
Interest Rate
3.48%
Mortgage Type
New Conventional
Purchase Details
Closed on
Jan 7, 2010
Sold by
Blakely Richard H and Blakely Ellen T
Bought by
Blakely Richard H
Purchase Details
Closed on
Feb 19, 1971
Bought by
Blakely Richard H and Geller Rachel
Create a Home Valuation Report for This Property
The Home Valuation Report is an in-depth analysis detailing your home's value as well as a comparison with similar homes in the area
Home Values in the Area
Average Home Value in this Area
Purchase History
| Date | Buyer | Sale Price | Title Company |
|---|---|---|---|
| Robert A Carney Jr Lt | -- | None Available | |
| Carney Robert A | $470,000 | -- | |
| Testamentary T T | -- | -- | |
| Blakely Richard H | -- | -- | |
| Blakely Richard H | $39,300 | -- |
Source: Public Records
Mortgage History
| Date | Status | Borrower | Loan Amount |
|---|---|---|---|
| Previous Owner | Carney Robert A | $376,000 |
Source: Public Records
Tax History
| Year | Tax Paid | Tax Assessment Tax Assessment Total Assessment is a certain percentage of the fair market value that is determined by local assessors to be the total taxable value of land and additions on the property. | Land | Improvement |
|---|---|---|---|---|
| 2025 | $9,697 | $851,400 | $524,200 | $327,200 |
| 2024 | $9,587 | $818,000 | $503,600 | $314,400 |
| 2023 | $9,286 | $737,600 | $454,100 | $283,500 |
| 2022 | $8,939 | $670,600 | $412,800 | $257,800 |
| 2021 | $8,318 | $658,800 | $395,500 | $263,300 |
| 2020 | $4,291 | $627,000 | $376,400 | $250,600 |
| 2019 | $8,498 | $597,200 | $358,500 | $238,700 |
| 2018 | $7,813 | $563,300 | $338,100 | $225,200 |
| 2017 | $7,698 | $531,400 | $319,000 | $212,400 |
| 2016 | $7,291 | $502,800 | $319,400 | $183,400 |
| 2015 | $6,831 | $464,700 | $295,200 | $169,500 |
| 2014 | $6,618 | $449,000 | $285,200 | $163,800 |
Source: Public Records
Map
Nearby Homes
- 150 Grove St
- 10 Meadow Brook Ln
- 115 Forest St
- 119 Van Norden Rd
- 43 Ashley Place
- 64 Longfellow Rd
- 35 Longfellow Rd
- 37 Fairchild Dr
- 89 Grand St
- 430 West St
- 61 Beaver Rd
- 863 Main St
- 17 Courtyard Place Unit 17
- 31 Zachary Ln
- 2 Inwood Dr Unit 1005
- 141 Johnson Woods Dr
- 45 Longview Rd
- 30 Taylor Dr Unit 3011
- 20 White Oaks Ln
- 52 Sanborn St Unit 7
Your Personal Tour Guide
Ask me questions while you tour the home.