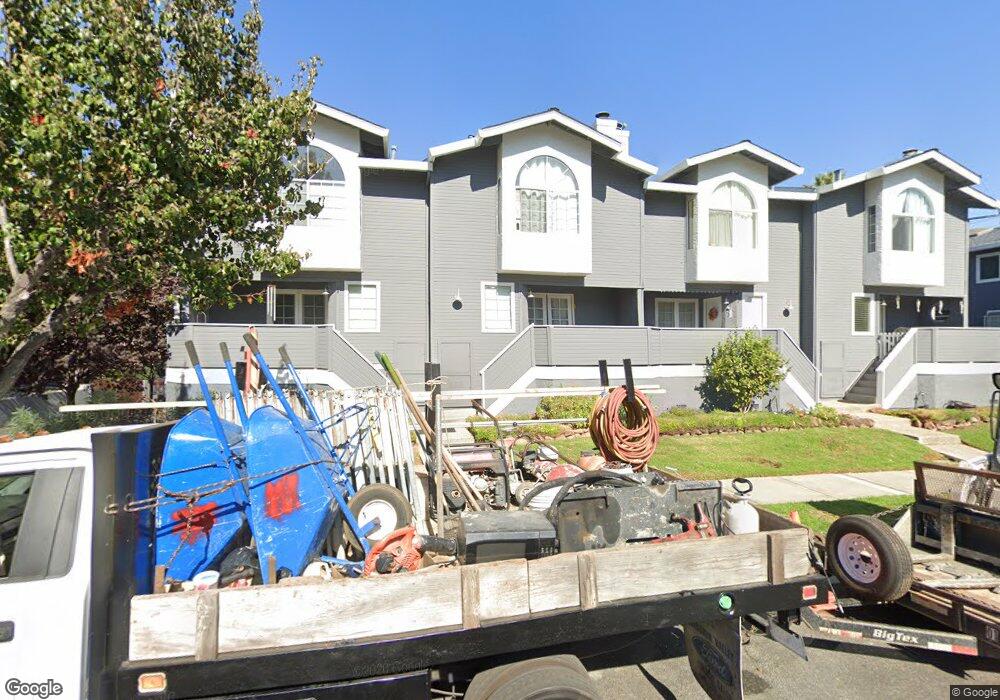
75 Union Ave Unit 2 Campbell, CA 95008
Estimated Value: $978,000 - $1,234,000
3
Beds
3
Baths
1,481
Sq Ft
$730/Sq Ft
Est. Value
About This Home
This home is located at 75 Union Ave Unit 2, Campbell, CA 95008 and is currently estimated at $1,081,836, approximately $730 per square foot. 75 Union Ave Unit 2 is a home located in Santa Clara County with nearby schools including Bagby Elementary School, Branham High School, and Price Charter Middle School.
Ownership History
Date
Name
Owned For
Owner Type
Purchase Details
Closed on
Mar 8, 2019
Sold by
Cormier Craven Charmayne Denise
Bought by
Craven Matt R
Current Estimated Value
Home Financials for this Owner
Home Financials are based on the most recent Mortgage that was taken out on this home.
Original Mortgage
$323,000
Outstanding Balance
$283,972
Interest Rate
4.4%
Mortgage Type
New Conventional
Estimated Equity
$797,864
Purchase Details
Closed on
Feb 25, 2019
Sold by
Craven Matt R
Bought by
Craven Matt R
Home Financials for this Owner
Home Financials are based on the most recent Mortgage that was taken out on this home.
Original Mortgage
$323,000
Outstanding Balance
$283,972
Interest Rate
4.4%
Mortgage Type
New Conventional
Estimated Equity
$797,864
Purchase Details
Closed on
Dec 19, 2005
Sold by
Meyer Joan S
Bought by
Craven Matt R
Create a Home Valuation Report for This Property
The Home Valuation Report is an in-depth analysis detailing your home's value as well as a comparison with similar homes in the area
Home Values in the Area
Average Home Value in this Area
Purchase History
| Date | Buyer | Sale Price | Title Company |
|---|---|---|---|
| Craven Matt R | -- | Fidelity National Title Co | |
| Craven Matt R | -- | Fidelity National Title Co | |
| Craven Matt R | -- | -- |
Source: Public Records
Mortgage History
| Date | Status | Borrower | Loan Amount |
|---|---|---|---|
| Open | Craven Matt R | $323,000 |
Source: Public Records
Tax History
| Year | Tax Paid | Tax Assessment Tax Assessment Total Assessment is a certain percentage of the fair market value that is determined by local assessors to be the total taxable value of land and additions on the property. | Land | Improvement |
|---|---|---|---|---|
| 2025 | $4,385 | $275,594 | $76,544 | $199,050 |
| 2024 | $4,385 | $270,192 | $75,044 | $195,148 |
| 2023 | $4,374 | $264,895 | $73,573 | $191,322 |
| 2022 | $4,322 | $259,702 | $72,131 | $187,571 |
| 2021 | $4,220 | $254,611 | $70,717 | $183,894 |
| 2020 | $4,030 | $252,001 | $69,992 | $182,009 |
| 2019 | $3,960 | $247,061 | $68,620 | $178,441 |
| 2018 | $3,751 | $242,218 | $67,275 | $174,943 |
| 2017 | $3,602 | $237,469 | $65,956 | $171,513 |
| 2016 | $3,405 | $232,813 | $64,663 | $168,150 |
| 2015 | $3,328 | $229,317 | $63,692 | $165,625 |
| 2014 | $3,207 | $224,826 | $62,445 | $162,381 |
Source: Public Records
Map
Nearby Homes
- 133 Union Ave Unit F
- 137 Union Ave Unit A
- 185 Union Ave Unit 78
- 913 Apricot Ave Unit B
- 970 Apricot Ave
- 374 Union Ave Unit D
- 466 Sam Cava Ln
- 912 Campisi Way Unit 417
- 511 Union Ave
- 523 Union Ave
- 110 S 1st St Unit 110
- 111 George Ct
- 77 S 1st St
- 350 N 1st St Unit 3
- 143 Kennedy Ave
- 101 Sunnyside Ave
- 1500 E Campbell Ave
- 381 Manchester Ave
- 61 N Leigh Ave
- 1482 Ridgeley Dr
- 75 Union Ave Unit 14
- 75 Union Ave Unit 1
- 75 Union Ave Unit 3
- 75 Union Ave Unit 4
- 75 Union Ave Unit 6
- 75 Union Ave Unit 7
- 75 Union Ave Unit 8
- 75 Union Ave Unit 9
- 75 Union Ave Unit 10
- 75 Union Ave Unit 11
- 75 Union Ave Unit 12
- 75 Union Ave Unit 13
- 75 Union Ave Unit 14
- 703 Duncanville Ct
- 702 Duncanville Ct
- 701 Duncanville Ct
- 704 Duncanville Ct
- 760 Duncanville Ct
- 705 Duncanville Ct
- 125 Union Ave
Your Personal Tour Guide
Ask me questions while you tour the home.