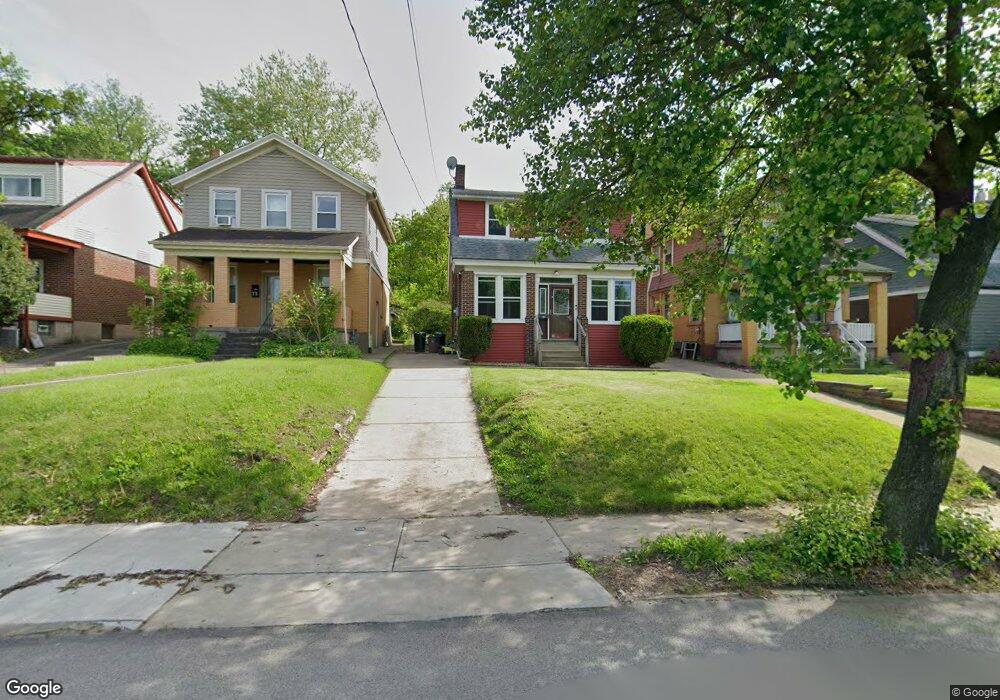
75 W Steuben St Pittsburgh, PA 15205
Estimated Value: $96,000 - $121,000
3
Beds
1
Bath
1,547
Sq Ft
$70/Sq Ft
Est. Value
About This Home
This home is located at 75 W Steuben St, Pittsburgh, PA 15205 and is currently estimated at $108,840, approximately $70 per square foot. 75 W Steuben St is a home located in Allegheny County with nearby schools including Carlynton Junior/Senior High School, St. Philip School, and Al-Andalus School.
Ownership History
Date
Name
Owned For
Owner Type
Purchase Details
Closed on
Apr 25, 2025
Sold by
Kirkham Kathleen T Trste and Lauritzen Doris J Trust
Bought by
Lageman Jessica L and Lageman Sean F
Current Estimated Value
Home Financials for this Owner
Home Financials are based on the most recent Mortgage that was taken out on this home.
Original Mortgage
$91,597
Outstanding Balance
$91,274
Interest Rate
6.67%
Mortgage Type
New Conventional
Estimated Equity
$17,566
Purchase Details
Closed on
May 16, 2019
Sold by
Lauritzen Jordan Carole and Jordan Charles Herbert
Bought by
Supplemental Kirkham Kathleen T and Doris J Lauritzen Supplemental Needs Tru
Purchase Details
Closed on
May 2, 2019
Sold by
Lauritzen Doris B
Bought by
Lauritzen Jordan Carole
Purchase Details
Closed on
Nov 9, 1959
Bought by
Laurtizen John F and Laurtizen Doris B
Create a Home Valuation Report for This Property
The Home Valuation Report is an in-depth analysis detailing your home's value as well as a comparison with similar homes in the area
Home Values in the Area
Average Home Value in this Area
Purchase History
| Date | Buyer | Sale Price | Title Company |
|---|---|---|---|
| Lageman Jessica L | $94,430 | -- | |
| Lageman Jessica L | $94,430 | -- | |
| Supplemental Kirkham Kathleen T | -- | None Available | |
| Lauritzen Jordan Carole | -- | None Available | |
| Laurtizen John F | -- | -- |
Source: Public Records
Mortgage History
| Date | Status | Borrower | Loan Amount |
|---|---|---|---|
| Open | Lageman Jessica L | $91,597 | |
| Closed | Lageman Jessica L | $91,597 |
Source: Public Records
Tax History Compared to Growth
Tax History
| Year | Tax Paid | Tax Assessment Tax Assessment Total Assessment is a certain percentage of the fair market value that is determined by local assessors to be the total taxable value of land and additions on the property. | Land | Improvement |
|---|---|---|---|---|
| 2025 | $3,177 | $79,300 | $20,000 | $59,300 |
| 2024 | $3,177 | $79,300 | $20,000 | $59,300 |
| 2023 | $3,177 | $79,300 | $20,000 | $59,300 |
| 2022 | $3,177 | $79,300 | $20,000 | $59,300 |
| 2021 | $375 | $79,300 | $20,000 | $59,300 |
| 2020 | $2,895 | $79,300 | $20,000 | $59,300 |
| 2019 | $2,196 | $61,300 | $20,000 | $41,300 |
| 2018 | $290 | $61,300 | $20,000 | $41,300 |
| 2017 | $2,077 | $61,300 | $20,000 | $41,300 |
| 2016 | $290 | $61,300 | $20,000 | $41,300 |
| 2015 | $290 | $61,300 | $20,000 | $41,300 |
| 2014 | $1,926 | $61,300 | $20,000 | $41,300 |
Source: Public Records
Map
Nearby Homes
- 77 W Steuben St
- 73 W Steuben St
- 79 W Steuben St
- 71 W Steuben St
- 61 W Steuben St
- 87 W Steuben St
- 57 W Steuben St
- 28 Richmond St
- 24 Richmond St
- 47 W Steuben St
- 101 W Steuben St
- 38 Belvidere St
- 33 Richmond St
- 40 Belvidere St
- 103 W Steuben St
- 29 Richmond St
- 26 Belvidere St
- 12 Belvidere St
- 44 Belvidere St
- 18 Richmond St