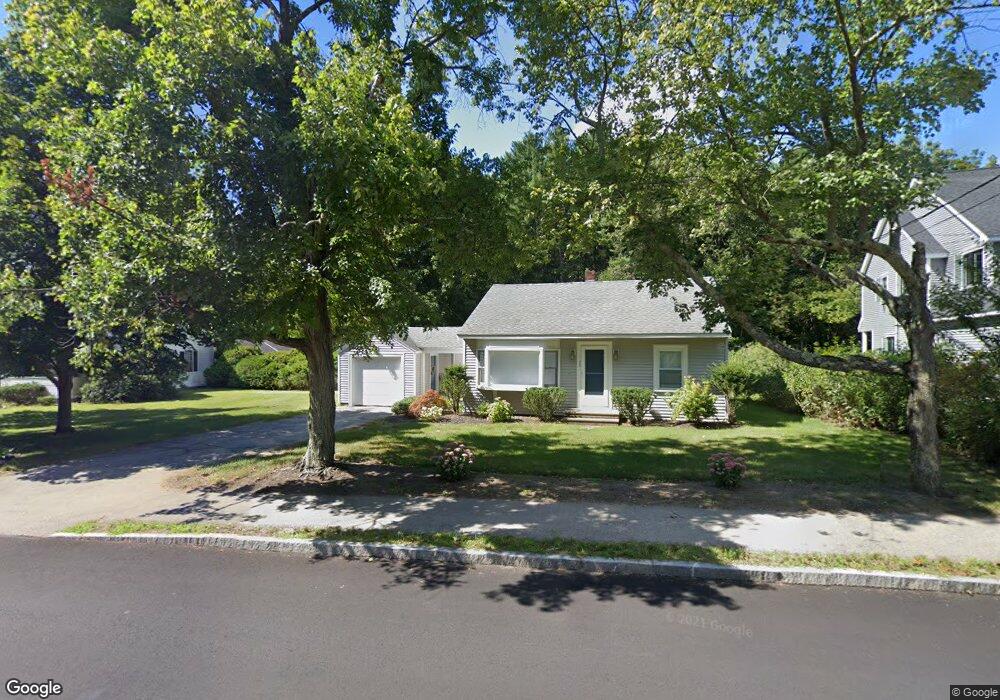
75 Woburn St Andover, MA 01810
Estimated Value: $609,000 - $764,000
3
Beds
1
Bath
1,080
Sq Ft
$623/Sq Ft
Est. Value
About This Home
This home is located at 75 Woburn St, Andover, MA 01810 and is currently estimated at $673,290, approximately $623 per square foot. 75 Woburn St is a home located in Essex County with nearby schools including South Elementary School, Doherty Middle School, and Andover High School.
Ownership History
Date
Name
Owned For
Owner Type
Purchase Details
Closed on
Sep 15, 2000
Sold by
Lau Victoria S and Sum Lawrence Kong Mui
Bought by
Lynch Bettr J
Current Estimated Value
Home Financials for this Owner
Home Financials are based on the most recent Mortgage that was taken out on this home.
Original Mortgage
$160,000
Interest Rate
8.07%
Mortgage Type
Purchase Money Mortgage
Purchase Details
Closed on
Nov 15, 1993
Sold by
Collins Daniel J
Bought by
Lau Victoria
Purchase Details
Closed on
May 30, 1990
Sold by
Martin Stanley A
Bought by
Collins Daniel J
Create a Home Valuation Report for This Property
The Home Valuation Report is an in-depth analysis detailing your home's value as well as a comparison with similar homes in the area
Home Values in the Area
Average Home Value in this Area
Purchase History
| Date | Buyer | Sale Price | Title Company |
|---|---|---|---|
| Lynch Bettr J | $221,500 | -- | |
| Lynch Bettr J | $221,500 | -- | |
| Lau Victoria | $148,700 | -- | |
| Lau Victoria | $148,700 | -- | |
| Collins Daniel J | $151,000 | -- | |
| Collins Daniel J | $151,000 | -- |
Source: Public Records
Mortgage History
| Date | Status | Borrower | Loan Amount |
|---|---|---|---|
| Open | Collins Daniel J | $165,000 | |
| Closed | Collins Daniel J | $160,000 |
Source: Public Records
Tax History Compared to Growth
Tax History
| Year | Tax Paid | Tax Assessment Tax Assessment Total Assessment is a certain percentage of the fair market value that is determined by local assessors to be the total taxable value of land and additions on the property. | Land | Improvement |
|---|---|---|---|---|
| 2024 | $8,198 | $636,500 | $428,500 | $208,000 |
| 2023 | $7,830 | $573,200 | $386,000 | $187,200 |
| 2022 | $7,256 | $497,000 | $335,600 | $161,400 |
| 2021 | $6,926 | $453,000 | $305,000 | $148,000 |
| 2020 | $6,636 | $442,100 | $297,400 | $144,700 |
| 2019 | $6,412 | $419,900 | $288,600 | $131,300 |
| 2018 | $6,229 | $398,300 | $277,700 | $120,600 |
| 2017 | $5,946 | $391,700 | $272,200 | $119,500 |
| 2016 | $5,805 | $391,700 | $272,200 | $119,500 |
| 2015 | $5,603 | $374,300 | $261,700 | $112,600 |
Source: Public Records
Map
Nearby Homes