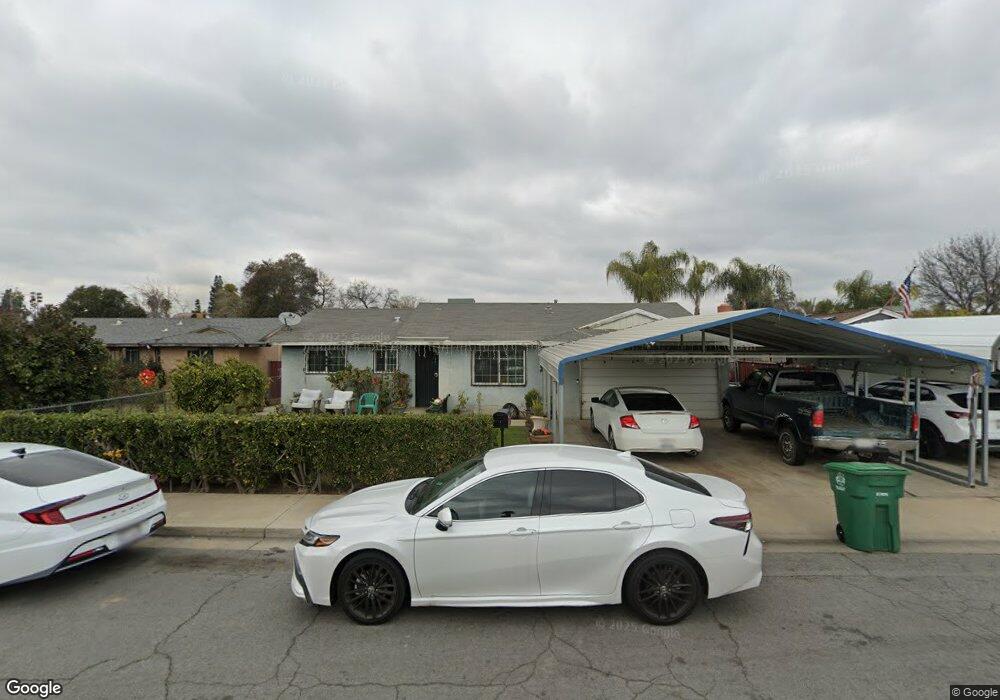
750 11th St Sanger, CA 93657
Estimated Value: $221,000 - $284,000
3
Beds
2
Baths
1,110
Sq Ft
$235/Sq Ft
Est. Value
About This Home
This home is located at 750 11th St, Sanger, CA 93657 and is currently estimated at $260,341, approximately $234 per square foot. 750 11th St is a home located in Fresno County with nearby schools including Jefferson Elementary School, Washington Academic Middle School, and Sanger High School.
Ownership History
Date
Name
Owned For
Owner Type
Purchase Details
Closed on
Jan 6, 2025
Sold by
Gutierrez Antonia
Bought by
Antonia Gutierrez Revocable Living Trust
Current Estimated Value
Purchase Details
Closed on
Jul 17, 2009
Sold by
Guiterrez Carlos and Gutierrez Antonia
Bought by
Gutierrez Carlos and Guterrez Antonia
Home Financials for this Owner
Home Financials are based on the most recent Mortgage that was taken out on this home.
Original Mortgage
$88,000
Interest Rate
5.59%
Mortgage Type
New Conventional
Create a Home Valuation Report for This Property
The Home Valuation Report is an in-depth analysis detailing your home's value as well as a comparison with similar homes in the area
Home Values in the Area
Average Home Value in this Area
Purchase History
| Date | Buyer | Sale Price | Title Company |
|---|---|---|---|
| Antonia Gutierrez Revocable Living Trust | -- | None Listed On Document | |
| Antonia Gutierrez Revocable Living Trust | -- | None Listed On Document | |
| Gutierrez Carlos | -- | Chicago Title Company |
Source: Public Records
Mortgage History
| Date | Status | Borrower | Loan Amount |
|---|---|---|---|
| Previous Owner | Gutierrez Carlos | $88,000 |
Source: Public Records
Tax History
| Year | Tax Paid | Tax Assessment Tax Assessment Total Assessment is a certain percentage of the fair market value that is determined by local assessors to be the total taxable value of land and additions on the property. | Land | Improvement |
|---|---|---|---|---|
| 2025 | $1,108 | $92,804 | $11,294 | $81,510 |
| 2023 | $1,036 | $89,202 | $10,856 | $78,346 |
| 2022 | $1,019 | $87,454 | $10,644 | $76,810 |
| 2021 | $1,009 | $85,740 | $10,436 | $75,304 |
| 2020 | $979 | $84,861 | $10,329 | $74,532 |
| 2019 | $958 | $83,198 | $10,127 | $73,071 |
| 2018 | $917 | $81,568 | $9,929 | $71,639 |
| 2017 | $900 | $79,970 | $9,735 | $70,235 |
| 2016 | $846 | $78,403 | $9,545 | $68,858 |
| 2015 | $851 | $77,226 | $9,402 | $67,824 |
| 2014 | $839 | $75,714 | $9,218 | $66,496 |
Source: Public Records
Map
Nearby Homes
Your Personal Tour Guide
Ask me questions while you tour the home.