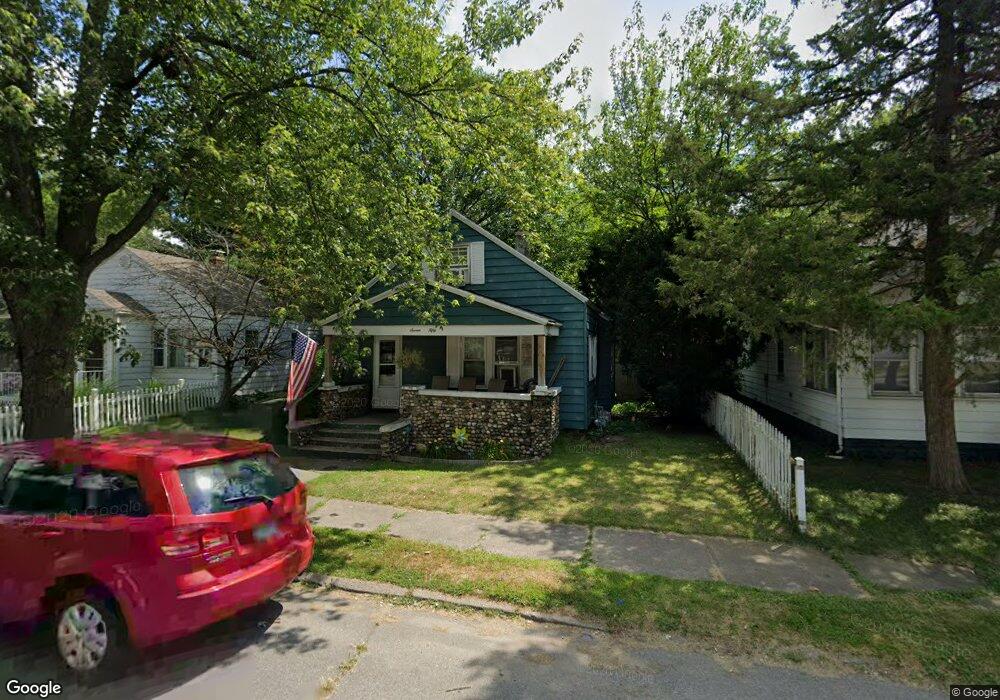
750 S 26th St South Bend, IN 46615
River Park NeighborhoodEstimated Value: $104,000 - $127,000
2
Beds
1
Bath
902
Sq Ft
$124/Sq Ft
Est. Value
About This Home
This home is located at 750 S 26th St, South Bend, IN 46615 and is currently estimated at $112,000, approximately $124 per square foot. 750 S 26th St is a home located in St. Joseph County with nearby schools including Cora B. Darling Elementary School, Nuner Fine Arts Academy, and Clay Intermediate Center.
Ownership History
Date
Name
Owned For
Owner Type
Purchase Details
Closed on
Aug 20, 2021
Sold by
Andrea Capital Investments Llc
Bought by
Opal Associates Llc
Current Estimated Value
Purchase Details
Closed on
Aug 19, 2021
Sold by
Adnrea Capital Investments Llc
Bought by
Opal Associates Llc
Purchase Details
Closed on
May 24, 2021
Sold by
Hodges David
Bought by
Andrea Capital Investments Llc
Purchase Details
Closed on
May 11, 2021
Sold by
Locker Ventures Llc
Bought by
Hodges David
Purchase Details
Closed on
Jun 4, 2020
Sold by
Hodges David
Bought by
Andrea Capital Investments Llc
Create a Home Valuation Report for This Property
The Home Valuation Report is an in-depth analysis detailing your home's value as well as a comparison with similar homes in the area
Home Values in the Area
Average Home Value in this Area
Purchase History
| Date | Buyer | Sale Price | Title Company |
|---|---|---|---|
| Opal Associates Llc | -- | None Listed On Document | |
| Opal Associates Llc | $32,000 | None Available | |
| Andrea Capital Investments Llc | $25,000 | None Available | |
| Hodges David | $25,000 | None Available | |
| Andrea Capital Investments Llc | -- | None Listed On Document |
Source: Public Records
Tax History Compared to Growth
Tax History
| Year | Tax Paid | Tax Assessment Tax Assessment Total Assessment is a certain percentage of the fair market value that is determined by local assessors to be the total taxable value of land and additions on the property. | Land | Improvement |
|---|---|---|---|---|
| 2024 | $1,290 | $61,400 | $5,900 | $55,500 |
| 2023 | $1,253 | $52,300 | $5,800 | $46,500 |
| 2022 | $1,253 | $91,500 | $5,800 | $85,700 |
| 2021 | $2,009 | $81,900 | $3,800 | $78,100 |
| 2020 | $1,851 | $70,500 | $3,200 | $67,300 |
| 2019 | $1,702 | $75,700 | $2,600 | $73,100 |
| 2018 | $1,713 | $64,700 | $2,200 | $62,500 |
| 2017 | $1,752 | $64,200 | $2,200 | $62,000 |
| 2016 | $1,790 | $64,300 | $2,200 | $62,100 |
| 2014 | $978 | $35,200 | $4,000 | $31,200 |
Source: Public Records
Map
Nearby Homes
- 806 S 26th St
- 634 S 26th St
- 815 S 26th St
- 537 S 27th St
- 525 S 28th St
- 513 S 26th St
- 510 S Ironwood Dr
- 1111 S 27th St
- 1017 S 23rd St
- 734 S 33rd St
- 3312 Mishawaka Ave
- 3312 E Jefferson Square
- 715 S 35th St
- 1105 S 35th St
- 930 S 34th St
- 2001 E Jefferson Blvd
- 741 S 36th St
- 3517 Mishawaka Ave
- 137 Monmoor Ave
- 1229 S 34th St