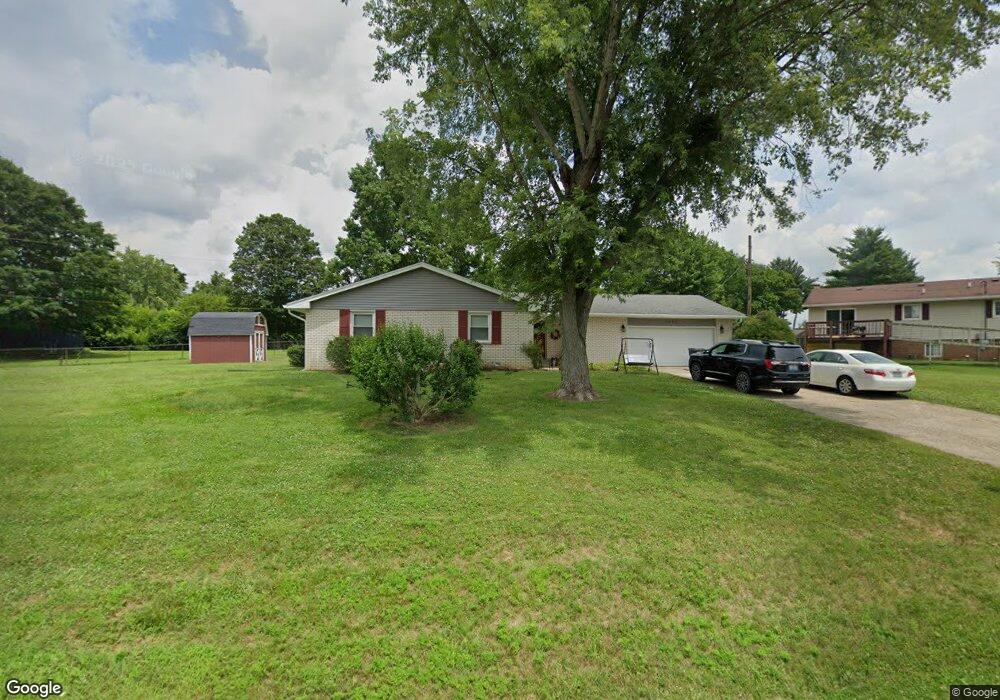
7500 Flamingo St Franklin, OH 45005
Estimated Value: $255,000 - $282,000
3
Beds
2
Baths
1,700
Sq Ft
$158/Sq Ft
Est. Value
About This Home
This home is located at 7500 Flamingo St, Franklin, OH 45005 and is currently estimated at $269,333, approximately $158 per square foot. 7500 Flamingo St is a home located in Warren County with nearby schools including Alden R Brown Elementary School, Chamberlain Middle School, and Carlisle High School.
Ownership History
Date
Name
Owned For
Owner Type
Purchase Details
Closed on
Feb 5, 2018
Sold by
Gable Rebekah and Gable Roger
Bought by
Gable Rebekah and Gable Roger
Current Estimated Value
Home Financials for this Owner
Home Financials are based on the most recent Mortgage that was taken out on this home.
Original Mortgage
$59,535
Outstanding Balance
$50,370
Interest Rate
3.95%
Mortgage Type
New Conventional
Estimated Equity
$218,963
Purchase Details
Closed on
Feb 15, 2017
Sold by
Lynd Rebekah A
Bought by
Gable Rebekah and Gable Roger
Purchase Details
Closed on
Mar 3, 1988
Sold by
Clark Roy L and Clark Joyce H
Bought by
Lynd and Lynd Rebekah A
Purchase Details
Closed on
Jun 7, 1978
Sold by
Holaday Holaday and Holaday Roy W
Create a Home Valuation Report for This Property
The Home Valuation Report is an in-depth analysis detailing your home's value as well as a comparison with similar homes in the area
Home Values in the Area
Average Home Value in this Area
Purchase History
| Date | Buyer | Sale Price | Title Company |
|---|---|---|---|
| Gable Rebekah | -- | -- | |
| Gable Rebekah | -- | -- | |
| Lynd | $65,000 | -- | |
| -- | $47,500 | -- |
Source: Public Records
Mortgage History
| Date | Status | Borrower | Loan Amount |
|---|---|---|---|
| Open | Gable Rebekah | $59,535 |
Source: Public Records
Tax History Compared to Growth
Tax History
| Year | Tax Paid | Tax Assessment Tax Assessment Total Assessment is a certain percentage of the fair market value that is determined by local assessors to be the total taxable value of land and additions on the property. | Land | Improvement |
|---|---|---|---|---|
| 2024 | $2,894 | $76,750 | $17,850 | $58,900 |
| 2023 | $2,320 | $56,311 | $11,151 | $45,160 |
| 2022 | $2,309 | $56,312 | $11,151 | $45,161 |
| 2021 | $2,227 | $56,312 | $11,151 | $45,161 |
| 2020 | $2,159 | $47,723 | $9,450 | $38,273 |
| 2019 | $2,188 | $47,723 | $9,450 | $38,273 |
| 2018 | $2,183 | $47,723 | $9,450 | $38,273 |
| 2017 | $2,171 | $40,198 | $8,250 | $31,948 |
| 2016 | $1,814 | $40,198 | $8,250 | $31,948 |
| 2015 | $1,740 | $40,198 | $8,250 | $31,948 |
| 2014 | $1,707 | $39,030 | $8,010 | $31,020 |
| 2013 | $1,691 | $51,170 | $10,500 | $40,670 |
Source: Public Records
Map
Nearby Homes
- 7311 Beth Ct
- 355 Ethelrob Cir
- 285 Nikki Ct
- 391 Sunset Dr
- 533 Clay St
- 7721 Lyn Dr
- 185 Christina Way
- 180 Vernon Place
- 8211 Sue Ave
- 7803 Lyn Dr
- 1020 Dubois Rd
- 95 Timber Creek Dr
- 102 Wolf Creek Ct
- 90 Timber Creek Dr
- 1223 Waterbury Dr
- 1215 Waterbury Dr
- 1221 Waterbury Dr
- 1227 Waterbury Dr
- 10641 Jamaica Rd
- 7464 Flamingo St
- 8775 Oriole Dr
- 7520 Flamingo St
- 7505 Flamingo St
- 8793 Oriole Dr
- 7479 Flamingo St
- 7529 Flamingo St
- 7538 Flamingo St
- 7553 Flamingo St
- 8811 Oriole Dr
- 7542 Skylark Cir
- 8760 Oriole Dr
- 8740 Oriole Dr
- 8776 Oriole Dr
- 8697 Oriole Dr
- 7556 Flamingo St
- 7528 Skylark Cir
- 8720 Oriole Dr
- 8794 Oriole Dr
- 7573 Flamingo St