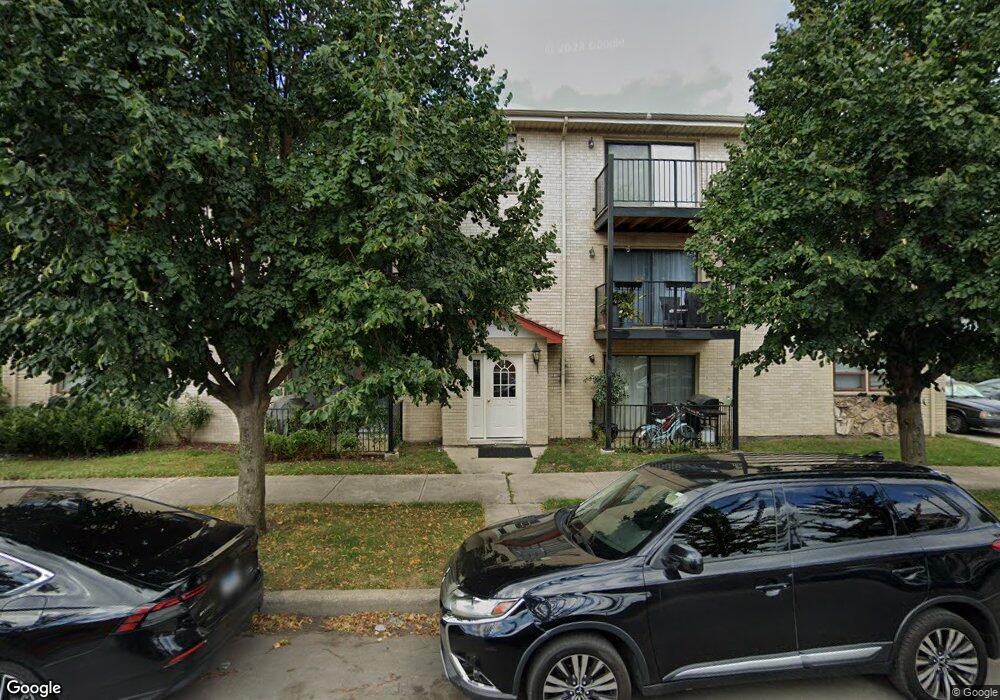
7500 W Addison St Unit 1N Chicago, IL 60634
Belmont Heights NeighborhoodEstimated Value: $200,213 - $300,000
--
Bed
--
Bath
7,569
Sq Ft
$31/Sq Ft
Est. Value
About This Home
This home is located at 7500 W Addison St Unit 1N, Chicago, IL 60634 and is currently estimated at $234,303, approximately $30 per square foot. 7500 W Addison St Unit 1N is a home located in Cook County with nearby schools including Dever Elementary School, Steinmetz College Prep, and St. Francis Borgia School.
Ownership History
Date
Name
Owned For
Owner Type
Purchase Details
Closed on
Aug 20, 2018
Sold by
Zamora Peter
Bought by
Schubach Gladys M and Schubach William J
Current Estimated Value
Purchase Details
Closed on
May 18, 1998
Sold by
The Chicago Trust Company
Bought by
Zamora Peter and Zamora Anne
Home Financials for this Owner
Home Financials are based on the most recent Mortgage that was taken out on this home.
Original Mortgage
$81,600
Outstanding Balance
$16,181
Interest Rate
7.27%
Estimated Equity
$218,122
Purchase Details
Closed on
Apr 25, 1997
Sold by
Cahill David F and Cahill Bridget
Bought by
Argianas John
Home Financials for this Owner
Home Financials are based on the most recent Mortgage that was taken out on this home.
Original Mortgage
$465,000
Interest Rate
9.25%
Purchase Details
Closed on
Mar 29, 1994
Sold by
Parkway Bank & Trust Company
Bought by
Cahill David F and Cahill Bridget
Create a Home Valuation Report for This Property
The Home Valuation Report is an in-depth analysis detailing your home's value as well as a comparison with similar homes in the area
Home Values in the Area
Average Home Value in this Area
Purchase History
| Date | Buyer | Sale Price | Title Company |
|---|---|---|---|
| Schubach Gladys M | -- | Attorney | |
| Zamora Peter | $182,000 | -- | |
| Argianas John | $485,000 | -- | |
| Cahill David F | -- | -- |
Source: Public Records
Mortgage History
| Date | Status | Borrower | Loan Amount |
|---|---|---|---|
| Open | Zamora Peter | $81,600 | |
| Previous Owner | Argianas John | $465,000 |
Source: Public Records
Tax History Compared to Growth
Tax History
| Year | Tax Paid | Tax Assessment Tax Assessment Total Assessment is a certain percentage of the fair market value that is determined by local assessors to be the total taxable value of land and additions on the property. | Land | Improvement |
|---|---|---|---|---|
| 2024 | $3,166 | $16,232 | $2,264 | $13,968 |
| 2023 | $3,087 | $15,000 | $1,811 | $13,189 |
| 2022 | $3,087 | $15,000 | $1,811 | $13,189 |
| 2021 | $3,018 | $14,999 | $1,810 | $13,189 |
| 2020 | $3,076 | $13,801 | $1,131 | $12,670 |
| 2019 | $2,404 | $15,390 | $1,131 | $14,259 |
| 2018 | $2,363 | $15,390 | $1,131 | $14,259 |
| 2017 | $1,688 | $11,211 | $995 | $10,216 |
| 2016 | $1,746 | $11,211 | $995 | $10,216 |
| 2015 | $1,575 | $11,211 | $995 | $10,216 |
| 2014 | $2,677 | $16,988 | $950 | $16,038 |
| 2013 | $2,613 | $16,988 | $950 | $16,038 |
Source: Public Records
Map
Nearby Homes
- 3615 N Osceola Ave
- 3631 N Oriole Ave
- 7408 W Addison St
- 3518 N Oleander Ave
- 3638 N Odell Ave
- 3649 N Overhill Ave
- 7515 W Roscoe St
- 3721 N Octavia Ave
- 3400 N Ottawa Ave
- 7431 W Forest Preserve Ave
- 3630 N Harlem Ave Unit 510
- 3630 N Harlem Ave Unit 205
- 3929 N Oleander Ave
- 3311 N Ozark Ave
- 3925 N Olcott Ave
- 3919 N Oriole Ave
- 3952 N Oleander Ave
- 3308 N Octavia Ave
- 3315 N Ozark Ave
- 7443 W Irving Park Rd Unit 4E
- 7500 W Addison St Unit 2N
- 7500 W Addison St Unit 2S
- 7500 W Addison St Unit 3N
- 7500 W Addison St Unit 1S
- 7500 W Addison St Unit 3S
- 7504 W Addison St
- 7508 W Addison St
- 7512 W Addison St
- 3614 N Olcott Ave
- 7514 W Addison St
- 3618 N Olcott Ave
- 7452 W Addison St
- 7518 W Addison St
- 3622 N Olcott Ave
- 3615 N Olcott Ave
- 7520 W Addison St
- 3626 N Olcott Ave
- 7501 W Addison St
- 7505 W Addison St
- 3617 N Olcott Ave