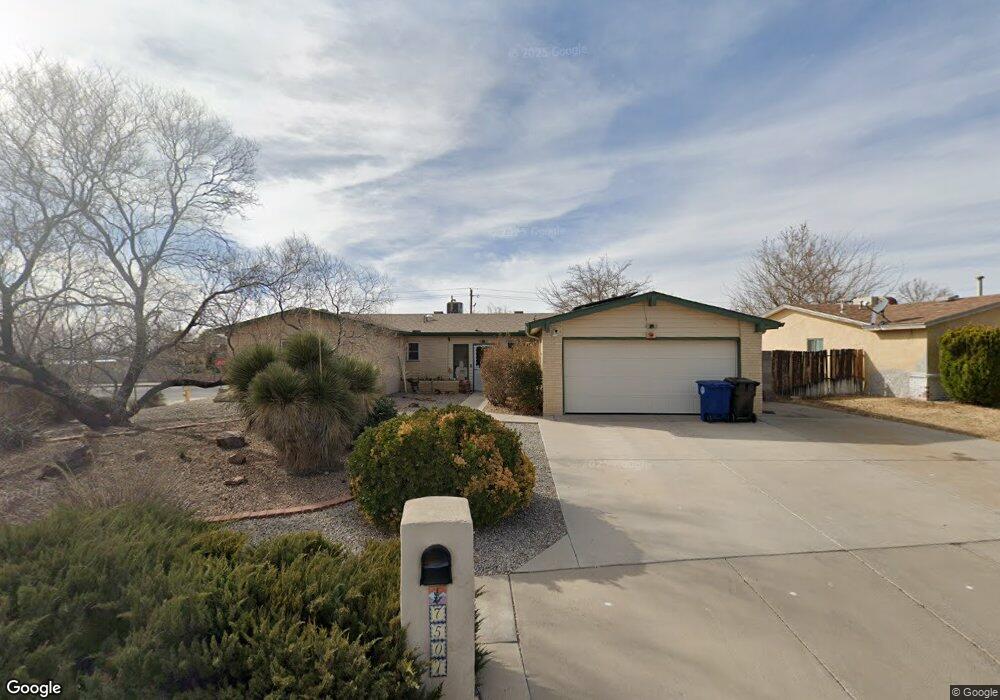
7501 Gill St NE Albuquerque, NM 87109
North Wyoming NeighborhoodEstimated Value: $345,000 - $376,000
3
Beds
2
Baths
1,708
Sq Ft
$209/Sq Ft
Est. Value
About This Home
This home is located at 7501 Gill St NE, Albuquerque, NM 87109 and is currently estimated at $356,277, approximately $208 per square foot. 7501 Gill St NE is a home located in Bernalillo County with nearby schools including Edmund G Ross Elementary School, McKinley Middle School, and Del Norte High School.
Ownership History
Date
Name
Owned For
Owner Type
Purchase Details
Closed on
Nov 8, 2018
Sold by
Burke Stuart A and Burke Joann P
Bought by
Burke Stuart A and Burke Joann P
Current Estimated Value
Purchase Details
Closed on
Feb 10, 2014
Sold by
Burke Stuart A and Burke Joann P
Bought by
Burke Stuart A and Burke Joann P
Home Financials for this Owner
Home Financials are based on the most recent Mortgage that was taken out on this home.
Original Mortgage
$200,000
Interest Rate
4.56%
Mortgage Type
VA
Purchase Details
Closed on
Oct 27, 2010
Sold by
Burke Joann P and Burke Stuart A
Bought by
Burke Stuart A and Burke Joann P
Home Financials for this Owner
Home Financials are based on the most recent Mortgage that was taken out on this home.
Original Mortgage
$179,346
Interest Rate
4.25%
Mortgage Type
FHA
Purchase Details
Closed on
Apr 20, 1999
Sold by
Burke Joann
Bought by
Burke Stuart A and Burke Jo Ann P
Create a Home Valuation Report for This Property
The Home Valuation Report is an in-depth analysis detailing your home's value as well as a comparison with similar homes in the area
Home Values in the Area
Average Home Value in this Area
Purchase History
| Date | Buyer | Sale Price | Title Company |
|---|---|---|---|
| Burke Stuart A | -- | None Available | |
| Burke Stuart A | -- | Fidelity Natl Title Of New M | |
| Burke Stuart A | -- | -- | |
| Burke Joann P | -- | None Available | |
| Burke Stuart A | -- | -- |
Source: Public Records
Mortgage History
| Date | Status | Borrower | Loan Amount |
|---|---|---|---|
| Closed | Burke Stuart A | $200,000 | |
| Closed | Burke Joann P | $179,346 |
Source: Public Records
Tax History Compared to Growth
Tax History
| Year | Tax Paid | Tax Assessment Tax Assessment Total Assessment is a certain percentage of the fair market value that is determined by local assessors to be the total taxable value of land and additions on the property. | Land | Improvement |
|---|---|---|---|---|
| 2025 | -- | $73,201 | $19,794 | $53,407 |
| 2024 | -- | $71,070 | $19,218 | $51,852 |
| 2023 | $0 | $69,000 | $18,658 | $50,342 |
| 2022 | $0 | $66,990 | $18,115 | $48,875 |
| 2021 | $0 | $65,040 | $17,588 | $47,452 |
| 2020 | $0 | $63,146 | $17,076 | $46,070 |
| 2019 | $0 | $61,307 | $16,578 | $44,729 |
| 2018 | $0 | $61,307 | $16,578 | $44,729 |
| 2017 | $0 | $59,522 | $16,096 | $43,426 |
| 2016 | $0 | $56,106 | $15,172 | $40,934 |
| 2015 | $54,472 | $54,472 | $14,731 | $39,741 |
| 2014 | -- | $52,886 | $14,302 | $38,584 |
| 2013 | -- | $51,346 | $13,885 | $37,461 |
Source: Public Records
Map
Nearby Homes
- 7109 Derickson Ave NE
- 6831 Jade Park Ave NE
- 7500 Loma Del Norte Rd NE
- 7401 Scotts Place NE
- 7712 Leanne St NE
- 7232 Gallinas Ave NE
- 7223 Laguna Niguel Dr NE
- 7500 Burke St NE
- 7813 Spencer Rd NE
- 6501 San Antonio Dr NE Unit 403
- 8000 Loma Del Norte Rd NE
- 6516 Pino Ave NE
- 7235 Whippoorwill Ln NE
- 6632 San Luis Obispo Ave NE
- 6625 Ranchitos Rd NE
- 7232 Bobwhite Ln NE
- 7339 Natalie Janae Ln NE
- 7108 Golden Eagle Place NE
- 6909 Welton Dr NE
- 7104 Quail Hollow NE
- 7505 Gill St NE
- 7109 Coulson Dr NE
- 7509 Gill St NE
- 7100 Coulson Dr NE
- 7108 Loma Del Norte Rd NE
- 6908 Jade Park Ave NE
- 6917 Gladys Ct NE
- 7104 Coulson Dr NE
- 7113 Coulson Dr NE
- 7108 Coulson Dr NE
- 7513 Gill St NE
- 6915 Jade Park Ave NE
- 7112 Loma Del Norte Rd NE
- 6916 Gladys Ct NE
- 7112 Coulson Dr NE
- 7117 Coulson Dr NE
- 7512 Gill St NE
- 7116 Loma Del Norte Rd NE
- 7517 Gill St NE
- 7101 Derickson Ave NE