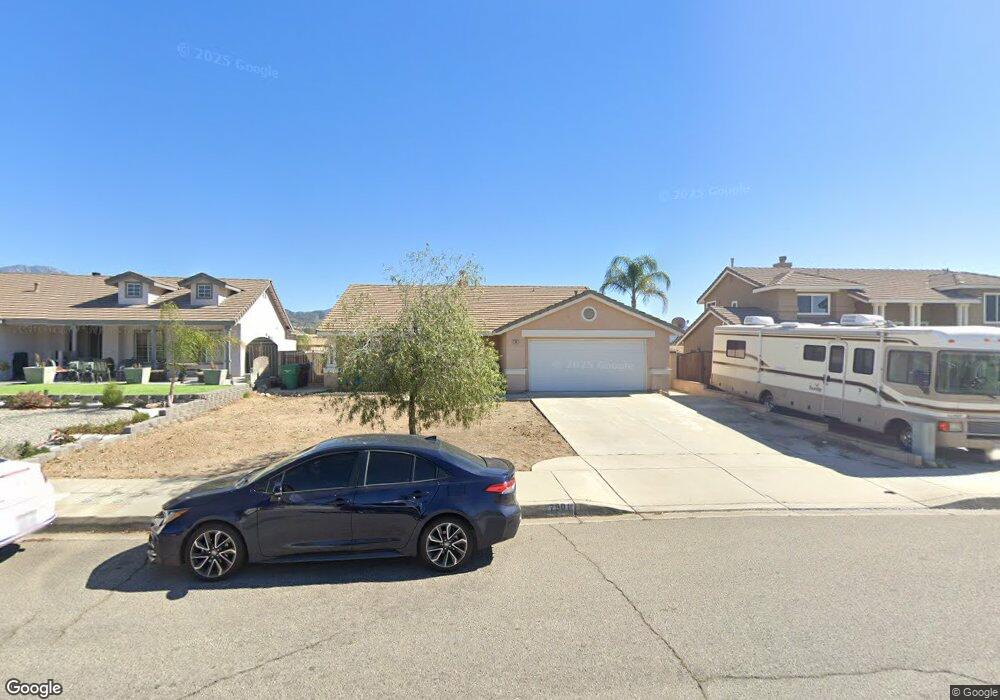
7501 Stoney Creek Dr Highland, CA 92346
East Highlands NeighborhoodEstimated Value: $526,000 - $567,000
3
Beds
2
Baths
1,418
Sq Ft
$386/Sq Ft
Est. Value
About This Home
This home is located at 7501 Stoney Creek Dr, Highland, CA 92346 and is currently estimated at $547,524, approximately $386 per square foot. 7501 Stoney Creek Dr is a home located in San Bernardino County with nearby schools including Thompson Elementary School, Serrano Middle School, and San Gorgonio High School.
Ownership History
Date
Name
Owned For
Owner Type
Purchase Details
Closed on
Oct 31, 2022
Sold by
Fernandez Jehoven S and Fernandez Leticia S
Bought by
Saldana Yessica Raya and Meza Juana Saldana
Current Estimated Value
Home Financials for this Owner
Home Financials are based on the most recent Mortgage that was taken out on this home.
Original Mortgage
$389,975
Interest Rate
7.08%
Purchase Details
Closed on
Mar 11, 2003
Sold by
Guillen Robert M and Guillen Melissa R
Bought by
Fernandez Jehoven S and Fernandez Leticia S
Home Financials for this Owner
Home Financials are based on the most recent Mortgage that was taken out on this home.
Original Mortgage
$120,000
Interest Rate
5.73%
Purchase Details
Closed on
Aug 18, 1997
Sold by
Kaufman & Broad Of Southern Calif
Bought by
Guillen Robert M and Guillen Melissa R
Home Financials for this Owner
Home Financials are based on the most recent Mortgage that was taken out on this home.
Original Mortgage
$119,512
Interest Rate
7.49%
Mortgage Type
FHA
Create a Home Valuation Report for This Property
The Home Valuation Report is an in-depth analysis detailing your home's value as well as a comparison with similar homes in the area
Home Values in the Area
Average Home Value in this Area
Purchase History
| Date | Buyer | Sale Price | Title Company |
|---|---|---|---|
| Saldana Yessica Raya | $410,500 | -- | |
| Fernandez Jehoven S | $185,000 | Nti | |
| Guillen Robert M | $121,500 | First American Title Ins Co |
Source: Public Records
Mortgage History
| Date | Status | Borrower | Loan Amount |
|---|---|---|---|
| Previous Owner | Saldana Yessica Raya | $389,975 | |
| Previous Owner | Fernandez Jehoven S | $120,000 | |
| Previous Owner | Guillen Robert M | $119,512 |
Source: Public Records
Tax History Compared to Growth
Tax History
| Year | Tax Paid | Tax Assessment Tax Assessment Total Assessment is a certain percentage of the fair market value that is determined by local assessors to be the total taxable value of land and additions on the property. | Land | Improvement |
|---|---|---|---|---|
| 2025 | $5,675 | $427,084 | $128,125 | $298,959 |
| 2024 | $5,675 | $418,710 | $125,613 | $293,097 |
| 2023 | $5,546 | $410,500 | $123,150 | $287,350 |
| 2022 | $3,661 | $252,489 | $63,123 | $189,366 |
| 2021 | $3,628 | $247,538 | $61,885 | $185,653 |
| 2020 | $3,625 | $244,999 | $61,250 | $183,749 |
| 2019 | $3,505 | $240,195 | $60,049 | $180,146 |
| 2018 | $3,401 | $235,486 | $58,872 | $176,614 |
| 2017 | $3,053 | $230,869 | $57,718 | $173,151 |
| 2016 | $2,964 | $226,342 | $56,586 | $169,756 |
| 2015 | $3,019 | $222,942 | $55,736 | $167,206 |
| 2014 | $2,845 | $218,575 | $54,644 | $163,931 |
Source: Public Records
Map
Nearby Homes
- 27856 Fieldstone Dr
- 7440 Apple Blossom Ct
- 7717 Church Ave Unit 166
- 7717 Church Ave Unit 142
- 7717 Church Ave Unit 160
- 7717 Church Ave Unit 54
- 7717 Church Ave Unit 77
- 7717 Church Ave Unit 214
- 7717 Church Ave Unit 95
- 7511 Buckeye St
- 2246 Springmeadow Ct
- 2255 Springmeadow Ct
- 0 Baseline St Unit CV25136921
- 28037 Clifton St
- 27328 Norwood St
- 7001 Church Ave Unit 5
- 6941 La Praix St
- 28480 Merridy Ave
- 6986 Church Ave
- 27471 Main St
- 7491 Stoney Creek Dr
- 7511 Stoney Creek Dr
- 7481 Stoney Creek Dr
- 7521 Stoney Creek Dr
- 7471 Stoney Creek Dr
- 7531 Stoney Creek Dr
- 27860 Norwood St
- 27853 Norwood St
- 7530 Stoney Creek Dr
- 7541 Stoney Creek Dr
- 7491 Windrose Dr
- 7481 Windrose Dr
- 27841 Norwood St
- 7540 Stoney Creek Dr
- 7551 Stoney Creek Dr
- 7461 Windrose Dr
- 27829 Norwood St
- 7561 Stoney Creek Dr
- 7490 Windrose Dr
- 7451 Windrose Dr