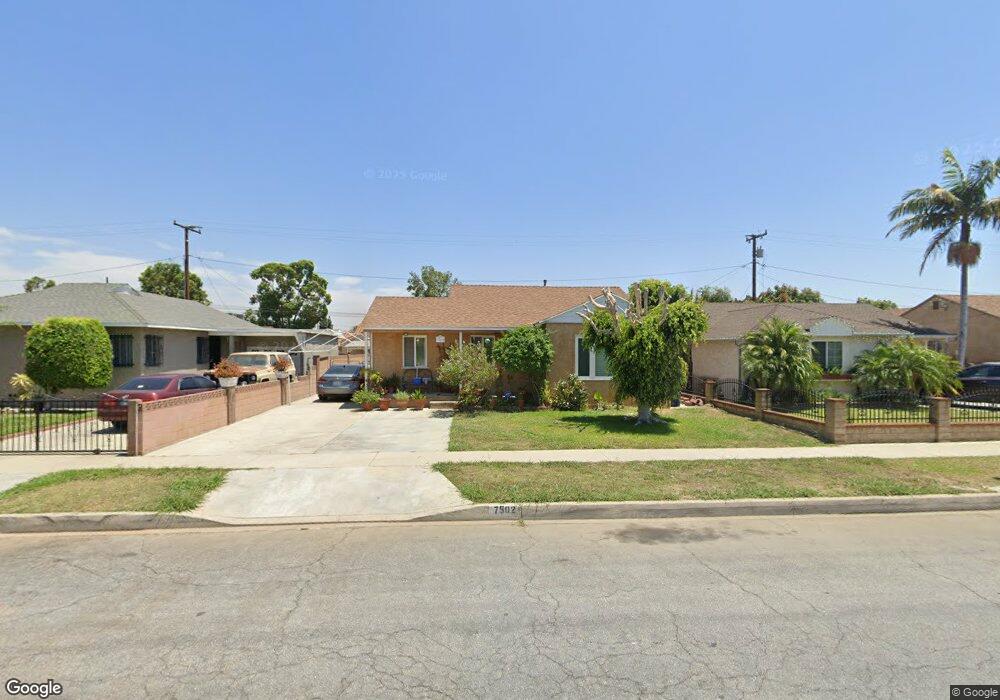
7502 Lindell Ave Pico Rivera, CA 90660
Estimated Value: $711,000 - $768,000
4
Beds
2
Baths
1,256
Sq Ft
$586/Sq Ft
Est. Value
About This Home
This home is located at 7502 Lindell Ave, Pico Rivera, CA 90660 and is currently estimated at $735,762, approximately $585 per square foot. 7502 Lindell Ave is a home located in Los Angeles County with nearby schools including Rivera Elementary School, El Rancho High School, and Ruben Salazar Continuation School.
Ownership History
Date
Name
Owned For
Owner Type
Purchase Details
Closed on
Sep 4, 1997
Sold by
Bankers Trust Company
Bought by
Corral Alberto A and Serrano Angelica J
Current Estimated Value
Home Financials for this Owner
Home Financials are based on the most recent Mortgage that was taken out on this home.
Original Mortgage
$152,898
Outstanding Balance
$23,841
Interest Rate
7.54%
Mortgage Type
VA
Estimated Equity
$711,921
Purchase Details
Closed on
Dec 20, 1996
Sold by
Castillo David
Bought by
Bankers Trust Company
Purchase Details
Closed on
Dec 16, 1996
Sold by
Castillo David
Bought by
Rivera Angie
Purchase Details
Closed on
Oct 17, 1996
Sold by
Castillo David
Bought by
Savone William G
Purchase Details
Closed on
Feb 13, 1996
Sold by
Castillo David
Bought by
Bankers Trust Company
Create a Home Valuation Report for This Property
The Home Valuation Report is an in-depth analysis detailing your home's value as well as a comparison with similar homes in the area
Home Values in the Area
Average Home Value in this Area
Purchase History
| Date | Buyer | Sale Price | Title Company |
|---|---|---|---|
| Corral Alberto A | $150,000 | First Southwestern Title Co | |
| Bankers Trust Company | $143,149 | Fidelity National Title Ins | |
| Rivera Angie | -- | -- | |
| Savone William G | -- | -- | |
| Bankers Trust Company | $130,021 | Fidelity National Title Ins |
Source: Public Records
Mortgage History
| Date | Status | Borrower | Loan Amount |
|---|---|---|---|
| Open | Corral Alberto A | $152,898 |
Source: Public Records
Tax History Compared to Growth
Tax History
| Year | Tax Paid | Tax Assessment Tax Assessment Total Assessment is a certain percentage of the fair market value that is determined by local assessors to be the total taxable value of land and additions on the property. | Land | Improvement |
|---|---|---|---|---|
| 2025 | $3,815 | $239,328 | $125,651 | $113,677 |
| 2024 | $3,815 | $234,637 | $123,188 | $111,449 |
| 2023 | $3,713 | $230,037 | $120,773 | $109,264 |
| 2022 | $3,551 | $225,527 | $118,405 | $107,122 |
| 2021 | $3,444 | $221,106 | $116,084 | $105,022 |
| 2019 | $3,416 | $214,550 | $112,642 | $101,908 |
| 2018 | $3,202 | $210,344 | $110,434 | $99,910 |
| 2016 | $2,899 | $202,178 | $106,147 | $96,031 |
| 2015 | $2,857 | $199,142 | $104,553 | $94,589 |
| 2014 | $2,826 | $195,242 | $102,505 | $92,737 |
Source: Public Records
Map
Nearby Homes
- 9213 Call St
- 7558 Citronell Ave
- 8826 Bermudez St
- 9208 Canford St
- 7019 Passons Blvd
- 9632 Abbotsford Rd
- 8216 Chaney Ave
- 6733 Candace Ave
- 8339 Manzanar Ave
- 8414 Cravell Ave
- 8328 Buhman Ave
- 9603 Homebrook St
- 8331 Vista Del Rosa St
- 7850 Birchcrest Rd
- 8322 Vista Del Rosa St
- 8514 Smallwood Ave
- 9311 Claymore St
- 7840 Pioneer Blvd
- 7700 Bangle Rd
- 9017 Arrington Ave
- 7506 Lindell Ave
- 7450 Lindell Ave
- 7505 Bequette Ave
- 7512 Lindell Ave
- 7446 Lindell Ave
- 7451 Bequette Ave
- 7509 Bequette Ave Unit 1
- 7509 Bequette Ave
- 7447 Bequette Ave
- 7505 Lindell Ave
- 7440 Lindell Ave
- 7516 Lindell Ave
- 7515 Bequette Ave
- 7449 Lindell Ave
- 7441 Bequette Ave
- 9014 Caddy St
- 7519 Bequette Ave
- 9015 Caddy St
- 7522 Lindell Ave
- 7434 Lindell Ave