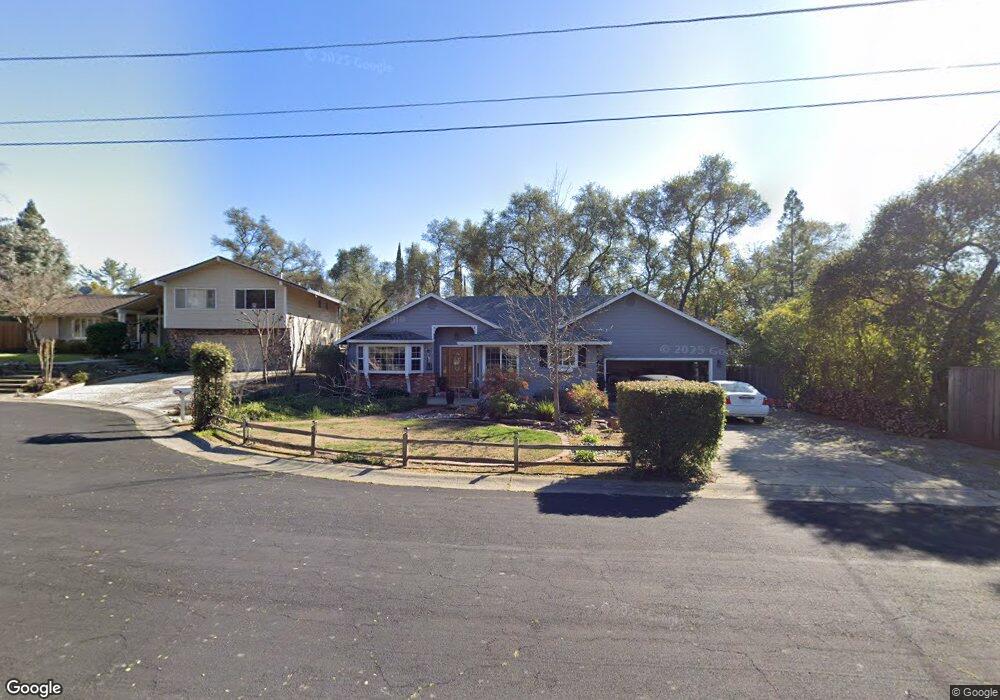
7502 Twig Ct Granite Bay, CA 95746
Estimated Value: $599,000 - $756,000
3
Beds
2
Baths
1,741
Sq Ft
$398/Sq Ft
Est. Value
About This Home
This home is located at 7502 Twig Ct, Granite Bay, CA 95746 and is currently estimated at $692,852, approximately $397 per square foot. 7502 Twig Ct is a home located in Placer County with nearby schools including Greenhills Elementary School, Ridgeview Elementary School, and Willma Cavitt Junior High School.
Ownership History
Date
Name
Owned For
Owner Type
Purchase Details
Closed on
Dec 29, 2009
Sold by
Jaynes Douglas C and Jaynes Tinina D
Bought by
Jaynes Tinina and Jaynes Douglas
Current Estimated Value
Purchase Details
Closed on
Oct 28, 2009
Sold by
Jaynes Tinina and Jaynes Douglas
Bought by
Jaynes Douglas C and Jaynes Tinina D
Purchase Details
Closed on
Aug 9, 2009
Sold by
Jaynes Douglas C and Jaynes Tinina D
Bought by
Jaynes Tinina and Jaynes Douglas
Purchase Details
Closed on
Nov 18, 1998
Sold by
Cortijo Richard J and Cortijo Carol A
Bought by
Jaynes Douglas C and Jaynes Tinina D
Home Financials for this Owner
Home Financials are based on the most recent Mortgage that was taken out on this home.
Original Mortgage
$169,600
Outstanding Balance
$37,835
Interest Rate
6.84%
Mortgage Type
Purchase Money Mortgage
Estimated Equity
$655,017
Create a Home Valuation Report for This Property
The Home Valuation Report is an in-depth analysis detailing your home's value as well as a comparison with similar homes in the area
Home Values in the Area
Average Home Value in this Area
Purchase History
| Date | Buyer | Sale Price | Title Company |
|---|---|---|---|
| Jaynes Tinina | -- | None Available | |
| Jaynes Douglas C | -- | None Available | |
| Jaynes Tinina | -- | None Available | |
| Jaynes Douglas C | $212,000 | Chicago Title Co |
Source: Public Records
Mortgage History
| Date | Status | Borrower | Loan Amount |
|---|---|---|---|
| Open | Jaynes Douglas C | $169,600 |
Source: Public Records
Tax History Compared to Growth
Tax History
| Year | Tax Paid | Tax Assessment Tax Assessment Total Assessment is a certain percentage of the fair market value that is determined by local assessors to be the total taxable value of land and additions on the property. | Land | Improvement |
|---|---|---|---|---|
| 2025 | $4,272 | $347,697 | $125,404 | $222,293 |
| 2023 | $4,272 | $334,198 | $120,536 | $213,662 |
| 2022 | $4,206 | $327,646 | $118,173 | $209,473 |
| 2021 | $4,135 | $321,222 | $115,856 | $205,366 |
| 2020 | $4,125 | $317,930 | $114,669 | $203,261 |
| 2019 | $4,091 | $311,697 | $112,421 | $199,276 |
| 2018 | $3,942 | $305,586 | $110,217 | $195,369 |
| 2017 | $3,960 | $299,595 | $108,056 | $191,539 |
| 2016 | $3,881 | $293,722 | $105,938 | $187,784 |
| 2015 | $3,812 | $289,311 | $104,347 | $184,964 |
| 2014 | $3,762 | $283,644 | $102,303 | $181,341 |
Source: Public Records
Map
Nearby Homes
- 7537 Dove Ct
- 8420 Lakeland Dr
- 8432 W Granite Dr
- 8177 E Granite Dr
- 7172 Cedar Oaks Dr
- 8293 Robert Ct
- 8395 W Hidden Lakes Dr
- 8465 Serene View Rd
- 7170 Wildwood Place
- SOL3 Plan at Premier Soleil
- SOL1+ Plan at Premier Soleil
- SOL4 Plan at Premier Soleil
- SOL2 Plan at Premier Soleil
- SOL1 Plan at Premier Soleil
- 8444 Sun View Cir
- 7080 Soleil Way
- 8460 Sun View Cir
- 7070 Soleil Way
- 7090 Soleil Way
- 8461 Sun View Cir
- 7512 Twig Ct
- 7532 Twig Ct
- 8260 Lakeland Dr
- 7491 Twig Ct
- 8255 Oak Knoll Dr
- 8235 Oak Knoll Dr
- 8280 Lakeland Dr
- 7521 Twig Ct
- 7527 Dove Ct
- 7510 Dove Ct
- 8275 Oak Knoll Dr
- 8200 Lakeland Dr
- 8302 W Granite Dr
- 8257 Lakeland Dr
- 8335 Oak Knoll Dr
- 8277 Lakeland Dr
- 7520 Dove Ct
- 8247 Lakeland Dr
- 8325 Oak Knoll Dr
- 8305 Oak Knoll Dr