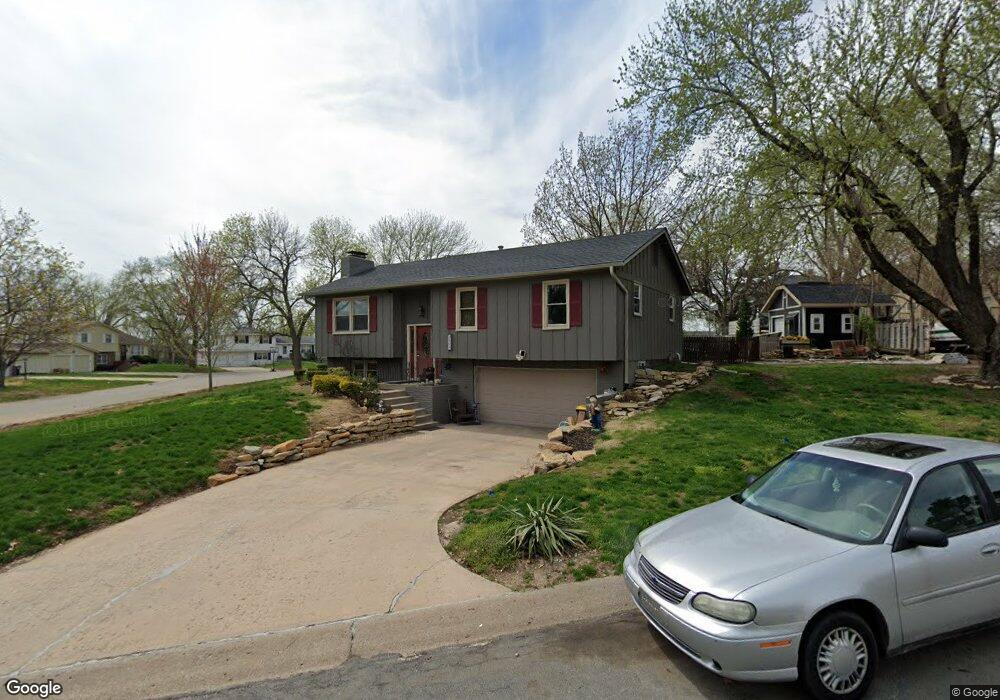
7504 Kessler Ln Overland Park, KS 66204
Estimated Value: $297,000 - $334,000
3
Beds
3
Baths
1,132
Sq Ft
$282/Sq Ft
Est. Value
About This Home
This home is located at 7504 Kessler Ln, Overland Park, KS 66204 and is currently estimated at $318,770, approximately $281 per square foot. 7504 Kessler Ln is a home located in Johnson County with nearby schools including Comanche Elementary School, Westridge Middle School, and Shawnee Mission West High School.
Ownership History
Date
Name
Owned For
Owner Type
Purchase Details
Closed on
Jun 27, 2018
Sold by
Cobb Judy A and Watters Ashley B
Bought by
Cobb Judy A
Current Estimated Value
Purchase Details
Closed on
Mar 21, 2016
Sold by
Cobb Judy A
Bought by
Watters Ashley B and Cobb Judy A
Purchase Details
Closed on
Aug 1, 2015
Sold by
Cobb Judy A and Cobb Darrin D
Bought by
Cobb Judy A
Purchase Details
Closed on
Mar 23, 2015
Sold by
Cobb Judy A and Cobb Darrin D
Bought by
Cobb Judy A
Purchase Details
Closed on
Aug 14, 2008
Sold by
Cobb Judy A
Bought by
Cobb Judy A and Cobb Darrin D
Purchase Details
Closed on
Jun 25, 2008
Sold by
Gilmore Todd and Gilmore Natalie
Bought by
Cobb Judy A
Purchase Details
Closed on
Jul 13, 2004
Sold by
Pounds W Sherlene and Kohley Robert
Bought by
Gilmore Todd and Gilmore Natalie
Home Financials for this Owner
Home Financials are based on the most recent Mortgage that was taken out on this home.
Original Mortgage
$136,852
Interest Rate
6.3%
Mortgage Type
FHA
Create a Home Valuation Report for This Property
The Home Valuation Report is an in-depth analysis detailing your home's value as well as a comparison with similar homes in the area
Home Values in the Area
Average Home Value in this Area
Purchase History
| Date | Buyer | Sale Price | Title Company |
|---|---|---|---|
| Cobb Judy A | -- | None Available | |
| Watters Ashley B | -- | None Available | |
| Cobb Judy A | -- | None Available | |
| Cobb Judy A | -- | None Available | |
| Cobb Judy A | -- | None Available | |
| Cobb Judy A | -- | Coffelt Land Title Inc | |
| Gilmore Todd | -- | Chicago Title Insurance Comp |
Source: Public Records
Mortgage History
| Date | Status | Borrower | Loan Amount |
|---|---|---|---|
| Previous Owner | Gilmore Todd | $136,852 |
Source: Public Records
Tax History Compared to Growth
Tax History
| Year | Tax Paid | Tax Assessment Tax Assessment Total Assessment is a certain percentage of the fair market value that is determined by local assessors to be the total taxable value of land and additions on the property. | Land | Improvement |
|---|---|---|---|---|
| 2024 | $2,808 | $29,510 | $6,153 | $23,357 |
| 2023 | $2,888 | $29,658 | $5,599 | $24,059 |
| 2022 | $2,495 | $25,852 | $5,599 | $20,253 |
| 2021 | $2,229 | $21,862 | $4,651 | $17,211 |
| 2020 | $2,038 | $20,022 | $4,651 | $15,371 |
| 2019 | $1,829 | $17,997 | $3,682 | $14,315 |
| 2018 | $1,789 | $17,537 | $3,682 | $13,855 |
| 2017 | $1,598 | $15,433 | $3,342 | $12,091 |
| 2016 | $1,529 | $14,536 | $3,342 | $11,194 |
| 2015 | $1,440 | $13,996 | $3,342 | $10,654 |
| 2013 | -- | $13,628 | $3,342 | $10,286 |
Source: Public Records
Map
Nearby Homes
- 8708 W 76th Terrace
- 7859 Kessler Ln
- 7522 Mackey St
- 7909 Grandview St
- 7649 Mackey St
- 7301 Antioch Rd
- 7240 Mastin St
- 8713 W 72nd St
- 8401 W 77th St
- 8037 Grandview Ln
- 7425 Stearns St
- 7205 Woodward St
- 10152 Edelweiss Cir
- 9906 Edelweiss Cir
- 9312 W 81st Terrace
- 7410 Stearns St
- 7923 Hadley St
- 7102 Mastin St
- 8808 W 81st Terrace
- 6901 Grandview St
- 7506 Kessler Ln
- 9200 W 75th Terrace
- 7505 Kessler Ln
- 7508 Kessler Ln
- 7524 Kessler Ln
- 7515 Kessler Ln
- 7516 Kessler Ln
- 9148 W 75th Terrace
- 7510 Kessler Ln
- 7519 Kessler Ln
- 9139 W 75th Terrace
- 9303 W 75th St
- 7514 Kessler Ln
- 9138 W 75th Terrace
- 9136 W 75th Terrace
- 7512 Kessler Ln
- 7525 Kessler Ln
- 7528 Kessler Ln
- 7650 W 75-2b St
- 9132 W 75th Terrace