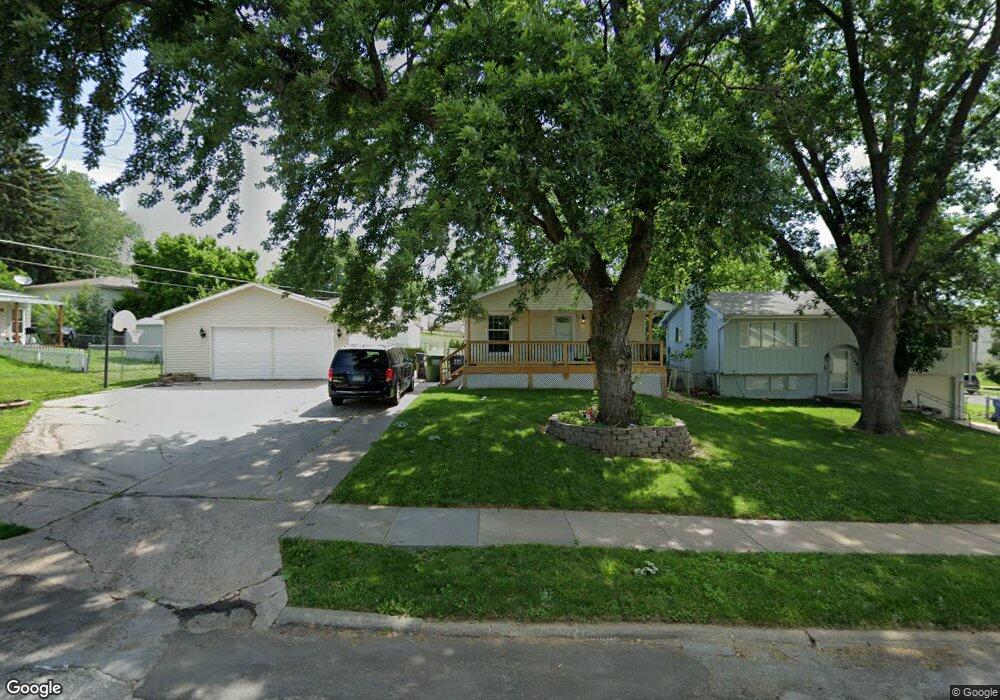
7505 S 76th Ave La Vista, NE 68128
Estimated Value: $241,000 - $273,214
3
Beds
2
Baths
1,920
Sq Ft
$133/Sq Ft
Est. Value
About This Home
This home is located at 7505 S 76th Ave, La Vista, NE 68128 and is currently estimated at $254,554, approximately $132 per square foot. 7505 S 76th Ave is a home located in Sarpy County with nearby schools including La Vista West Elementary School, La Vista Middle School, and Papillion La Vista Senior High School.
Ownership History
Date
Name
Owned For
Owner Type
Purchase Details
Closed on
Aug 20, 2009
Sold by
Smith Brett L and Smith Diana L
Bought by
Bevirt Jeffrey H and Bevirt Kristi S
Current Estimated Value
Home Financials for this Owner
Home Financials are based on the most recent Mortgage that was taken out on this home.
Original Mortgage
$127,645
Outstanding Balance
$83,013
Interest Rate
5.16%
Estimated Equity
$171,541
Purchase Details
Closed on
Sep 2, 2004
Sold by
Boukal James A and Henkensiefken Darlene A
Bought by
Smith Brett L and Smith Diana L
Home Financials for this Owner
Home Financials are based on the most recent Mortgage that was taken out on this home.
Original Mortgage
$98,112
Interest Rate
6.08%
Purchase Details
Closed on
Jan 23, 2004
Sold by
Boukal James L and Boukal James A
Bought by
Boukal James A and Henkensiefken Darlene A
Home Financials for this Owner
Home Financials are based on the most recent Mortgage that was taken out on this home.
Original Mortgage
$81,600
Interest Rate
5.79%
Create a Home Valuation Report for This Property
The Home Valuation Report is an in-depth analysis detailing your home's value as well as a comparison with similar homes in the area
Home Values in the Area
Average Home Value in this Area
Purchase History
| Date | Buyer | Sale Price | Title Company |
|---|---|---|---|
| Bevirt Jeffrey H | $130,000 | Fat | |
| Smith Brett L | $96,000 | -- | |
| Boukal James A | -- | -- |
Source: Public Records
Mortgage History
| Date | Status | Borrower | Loan Amount |
|---|---|---|---|
| Open | Bevirt Jeffrey H | $127,645 | |
| Closed | Smith Brett L | $98,112 | |
| Previous Owner | Boukal James A | $81,600 |
Source: Public Records
Tax History Compared to Growth
Tax History
| Year | Tax Paid | Tax Assessment Tax Assessment Total Assessment is a certain percentage of the fair market value that is determined by local assessors to be the total taxable value of land and additions on the property. | Land | Improvement |
|---|---|---|---|---|
| 2025 | $3,591 | $236,285 | $30,000 | $206,285 |
| 2024 | $4,097 | $216,497 | $28,000 | $188,497 |
| 2023 | $4,097 | $202,659 | $25,000 | $177,659 |
| 2022 | $3,705 | $172,571 | $22,000 | $150,571 |
| 2021 | $3,513 | $161,251 | $20,000 | $141,251 |
| 2020 | $3,396 | $154,283 | $20,000 | $134,283 |
| 2019 | $3,212 | $146,045 | $18,000 | $128,045 |
| 2018 | $2,979 | $133,463 | $18,000 | $115,463 |
| 2017 | $2,777 | $124,461 | $18,000 | $106,461 |
| 2016 | $2,641 | $118,531 | $18,000 | $100,531 |
| 2015 | $2,640 | $118,801 | $18,000 | $100,801 |
| 2014 | $2,617 | $117,000 | $18,000 | $99,000 |
| 2012 | -- | $116,079 | $18,000 | $98,079 |
Source: Public Records
Map
Nearby Homes
- 7544 Olive Ave
- 7713 Cottonwood Ave
- 7712 Cottonwood Ave
- 7511 Joseph Ave
- 7518 Diane Ct
- 7322 Ira Ct
- 7405 Joseph Ave
- 7324 Frederick Ave
- 7814 Leaf Plum Dr
- 7822 Leaf Plum Dr
- 7405 Josephine St
- 7201 James Ave
- 7606 Emiline St
- 7215 S 81st St
- 7336 S 71st Ave
- 809 Joseph Dr
- 7432 La Vista Dr
- 6901 S 78th St
- 7439 S 69th St
- 1310 Edgewood Blvd
- 7509 S 76th Ave
- 7501 S 76th Ave
- 7545 Lillian Ave
- 7610 Susan Ave
- 7506 S 76th Ave
- 7541 Lillian Ave
- 7502 S 76th Ave
- 7510 S 76th Ave
- 7608 Susan Ave
- 7508 S 76th Ave
- 7537 Lillian Ave
- 7607 Susan Ave
- 7605 Lillian Ave
- 7512 S 76th Ave
- 7605 Susan Ave
- 7604 Susan Ave
- 7533 Lillian Ave
- 7413 S 76th Ave
- 7544 Lillian Ave
- 7540 Lillian Ave