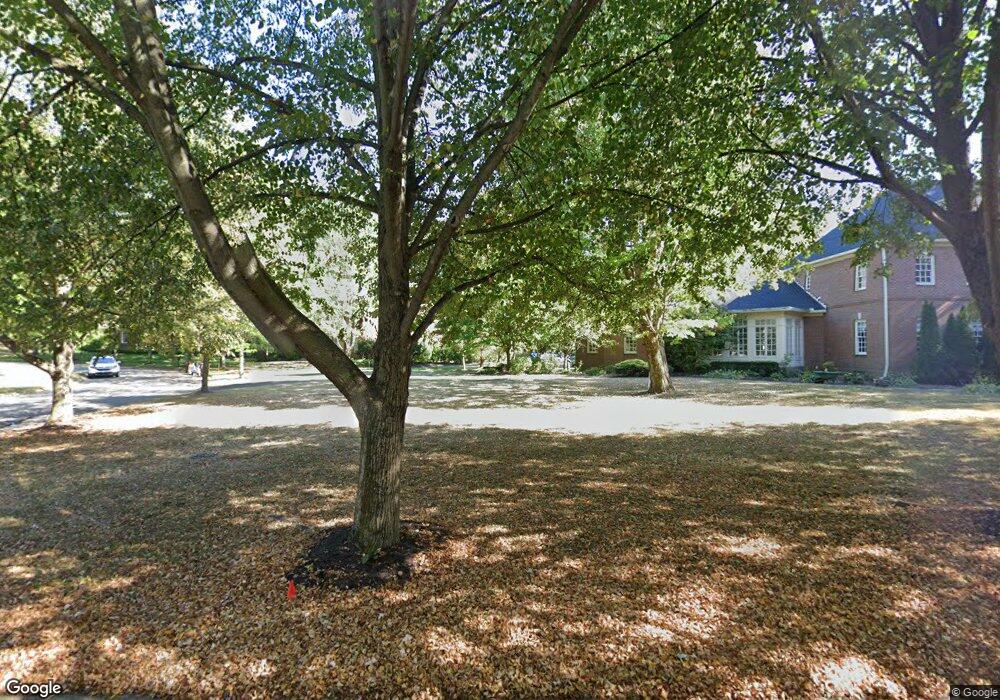
7507 Fenway Rd New Albany, OH 43054
Estimated Value: $1,397,000 - $1,645,877
5
Beds
6
Baths
5,638
Sq Ft
$270/Sq Ft
Est. Value
About This Home
This home is located at 7507 Fenway Rd, New Albany, OH 43054 and is currently estimated at $1,521,969, approximately $269 per square foot. 7507 Fenway Rd is a home located in Franklin County with nearby schools including New Albany Primary School, New Albany Intermediate School, and New Albany Middle School.
Ownership History
Date
Name
Owned For
Owner Type
Purchase Details
Closed on
Apr 5, 2004
Sold by
Lyle Daniel R and Lyle Myra
Bought by
Fisher Joel I
Current Estimated Value
Purchase Details
Closed on
Jun 28, 2000
Sold by
Fisher Joel I and Fisher Donna J
Bought by
Lyle Daniel R and Lyle Myra
Home Financials for this Owner
Home Financials are based on the most recent Mortgage that was taken out on this home.
Original Mortgage
$959,500
Interest Rate
8.12%
Purchase Details
Closed on
Jul 8, 1992
Bought by
Fisher Joel I and Fisher Donna J
Create a Home Valuation Report for This Property
The Home Valuation Report is an in-depth analysis detailing your home's value as well as a comparison with similar homes in the area
Home Values in the Area
Average Home Value in this Area
Purchase History
| Date | Buyer | Sale Price | Title Company |
|---|---|---|---|
| Fisher Joel I | $975,000 | Chicago Title | |
| Lyle Daniel R | $900,000 | Title First Agency Inc | |
| Fisher Joel I | $645,000 | -- |
Source: Public Records
Mortgage History
| Date | Status | Borrower | Loan Amount |
|---|---|---|---|
| Previous Owner | Lyle Daniel R | $959,500 |
Source: Public Records
Tax History Compared to Growth
Tax History
| Year | Tax Paid | Tax Assessment Tax Assessment Total Assessment is a certain percentage of the fair market value that is determined by local assessors to be the total taxable value of land and additions on the property. | Land | Improvement |
|---|---|---|---|---|
| 2024 | $24,578 | $395,050 | $80,850 | $314,200 |
| 2023 | $23,233 | $395,045 | $80,850 | $314,195 |
| 2022 | $22,094 | $285,500 | $55,130 | $230,370 |
| 2021 | $21,264 | $285,500 | $55,130 | $230,370 |
| 2020 | $21,239 | $285,500 | $55,130 | $230,370 |
| 2019 | $22,089 | $271,530 | $52,500 | $219,030 |
| 2018 | $24,212 | $271,530 | $52,500 | $219,030 |
| 2017 | $22,304 | $271,530 | $52,500 | $219,030 |
| 2016 | $26,547 | $300,760 | $62,760 | $238,000 |
| 2015 | $26,597 | $300,760 | $62,760 | $238,000 |
| 2014 | $24,936 | $300,760 | $62,760 | $238,000 |
| 2013 | $12,833 | $286,440 | $59,780 | $226,660 |
Source: Public Records
Map
Nearby Homes
- 5945 Johnstown Rd
- 5950 Johnstown Rd
- 7 Richmond Square
- 14 Richmond Square
- 6929 Clivdon Mews
- 4135 High Grove Crest
- 7030 Hanby's Loop
- 115 Keswick Dr
- 105 Keswick Dr
- 3637 Head of Pond Rd
- 7747 Sutton Place
- 7362 Tottenham Place
- 6590 Wheatly Rd
- 3920 Lewis Link Dr
- 3377 Abberley Dr Unit LOT 902
- 6540 Wheatly Rd Unit LOT 701
- 6544 Wheatly Rd Unit LOT 702
- 6526 Wheatly Rd Unit LOT 802
- 6531 Wheatly Rd Unit LOT 102
- 6522 Wheatly Rd Unit LOT 801
- 7516 N Goodrich Square
- 7531 Ehret Round
- 7502 N Goodrich Square
- 7530 N Goodrich Square
- 4220 Baughman Grant
- 7506 Fenway Rd
- 7528 Fenway Rd
- 7544 N Goodrich Square
- 7476 Fenway Rd
- 7547 Ehret Round
- 6256 N Goodrich Square
- 7558 N Goodrich Square
- 4184 Baughman Grant
- 7559 Ehret Round
- 7543 N Goodrich Square
- 7570 N Goodrich Square
- 7574 Fenway Rd
- 7557 N Goodrich Square
- 7571 Fenway Rd
- 7584 N Goodrich Square