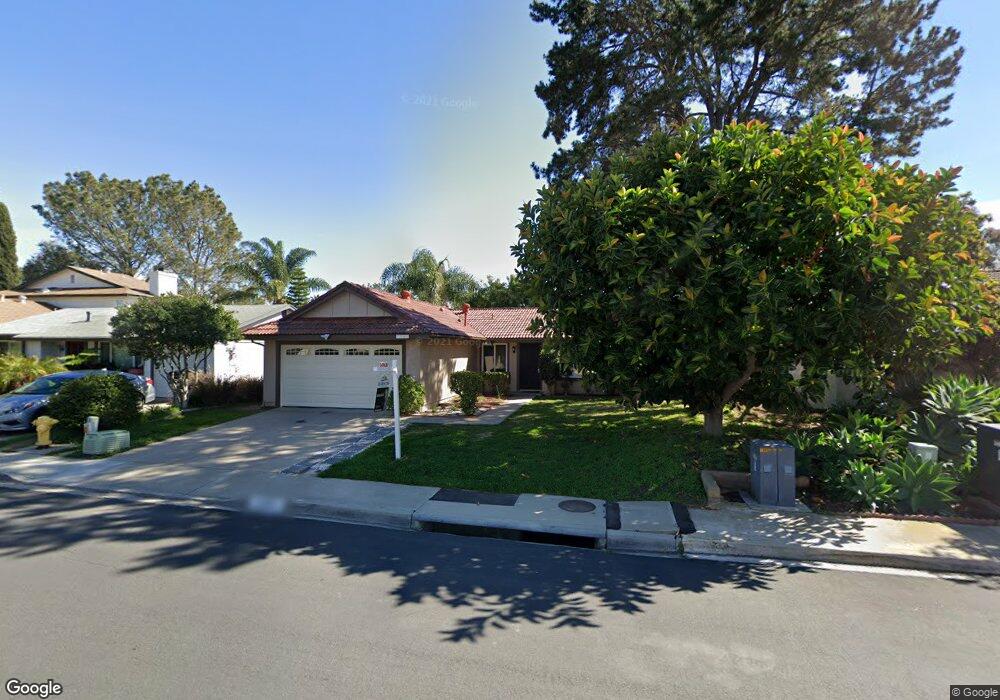
7507 New Salem St San Diego, CA 92126
Mira Mesa NeighborhoodEstimated Value: $980,981 - $1,153,000
3
Beds
2
Baths
1,134
Sq Ft
$923/Sq Ft
Est. Value
About This Home
This home is located at 7507 New Salem St, San Diego, CA 92126 and is currently estimated at $1,046,745, approximately $923 per square foot. 7507 New Salem St is a home located in San Diego County with nearby schools including Hickman Elementary School, Challenger Middle School, and Mira Mesa High School.
Ownership History
Date
Name
Owned For
Owner Type
Purchase Details
Closed on
Mar 4, 2019
Sold by
Leo Endeavors Llc
Bought by
Nguyen Tracy Trang
Current Estimated Value
Home Financials for this Owner
Home Financials are based on the most recent Mortgage that was taken out on this home.
Original Mortgage
$340,000
Outstanding Balance
$298,918
Interest Rate
4.4%
Mortgage Type
New Conventional
Estimated Equity
$747,827
Purchase Details
Closed on
Mar 7, 2017
Sold by
Leo Randall B and Ghia Leo Sharon
Bought by
Leo Endeavors Llc
Purchase Details
Closed on
Sep 18, 2009
Sold by
Leo Randall B
Bought by
Leo Randall B and Chia Leo Sharon
Purchase Details
Closed on
Dec 14, 1995
Sold by
Chia Ai Ching
Bought by
Leo Randall B
Home Financials for this Owner
Home Financials are based on the most recent Mortgage that was taken out on this home.
Original Mortgage
$126,000
Interest Rate
7.38%
Purchase Details
Closed on
Apr 8, 1991
Purchase Details
Closed on
Oct 2, 1987
Create a Home Valuation Report for This Property
The Home Valuation Report is an in-depth analysis detailing your home's value as well as a comparison with similar homes in the area
Home Values in the Area
Average Home Value in this Area
Purchase History
| Date | Buyer | Sale Price | Title Company |
|---|---|---|---|
| Nguyen Tracy Trang | $591,000 | First American Title | |
| Leo Endeavors Llc | -- | None Available | |
| Leo Randall B | -- | First American Title Company | |
| Leo Randall B | -- | Fidelity National Title | |
| -- | $167,000 | -- | |
| -- | $125,000 | -- |
Source: Public Records
Mortgage History
| Date | Status | Borrower | Loan Amount |
|---|---|---|---|
| Open | Nguyen Tracy Trang | $340,000 | |
| Previous Owner | Leo Randall B | $126,000 |
Source: Public Records
Tax History Compared to Growth
Tax History
| Year | Tax Paid | Tax Assessment Tax Assessment Total Assessment is a certain percentage of the fair market value that is determined by local assessors to be the total taxable value of land and additions on the property. | Land | Improvement |
|---|---|---|---|---|
| 2025 | $7,990 | $659,267 | $501,981 | $157,286 |
| 2024 | $7,990 | $646,341 | $492,139 | $154,202 |
| 2023 | $7,813 | $633,669 | $482,490 | $151,179 |
| 2022 | $7,605 | $621,245 | $473,030 | $148,215 |
| 2021 | $7,552 | $609,064 | $463,755 | $145,309 |
| 2020 | $7,461 | $602,820 | $459,000 | $143,820 |
| 2019 | $3,373 | $270,000 | $106,472 | $163,528 |
| 2018 | $3,155 | $264,707 | $104,385 | $160,322 |
| 2017 | $3,077 | $259,518 | $102,339 | $157,179 |
| 2016 | $3,027 | $254,431 | $100,333 | $154,098 |
| 2015 | $2,983 | $250,610 | $98,826 | $151,784 |
| 2014 | $2,937 | $245,702 | $96,891 | $148,811 |
Source: Public Records
Map
Nearby Homes
- 7561 Windsong Rd
- 7387 New Salem St
- 7736 Alcamo Rd
- 10692 Dabney Dr Unit 102
- 10785 Chinon Cir
- 10668 Dabney Dr Unit 122
- 10668 Dabney Dr Unit 125
- 10774 Dabney Dr Unit 20
- 7684 Adkins Way
- 10606 Aderman Ave Unit 5
- 10646 Aderman Ave Unit 21
- 10740 Aderman Ave Unit 66
- 10628 Kemerton Rd
- 8007 New Salem St
- 7385 Calle Cristobal Unit 225
- 7365 Calle Cristobal Unit 197
- 7944 Calico St
- 7349 Calle Cristobal Unit 181
- 7506 Flanders Dr
- 7220 Calle Cristobal Unit 12
- 7497 New Salem St
- 7513 New Salem St
- 7519 New Salem St
- 7477 New Salem St
- 10805 Sunny Meadow St
- 7525 New Salem St
- 7512 New Salem St
- 7487 New Salem St
- 7467 New Salem St
- 10817 Sunny Meadow St
- 7520 New Salem St
- 7531 New Salem St
- 7528 New Salem St
- 10829 Sunny Meadow St
- 7468 New Salem St
- 7457 New Salem St
- 10880 Barbados Way
- 7537 New Salem St
- 7452 New Salem St
- 10841 Sunny Meadow St