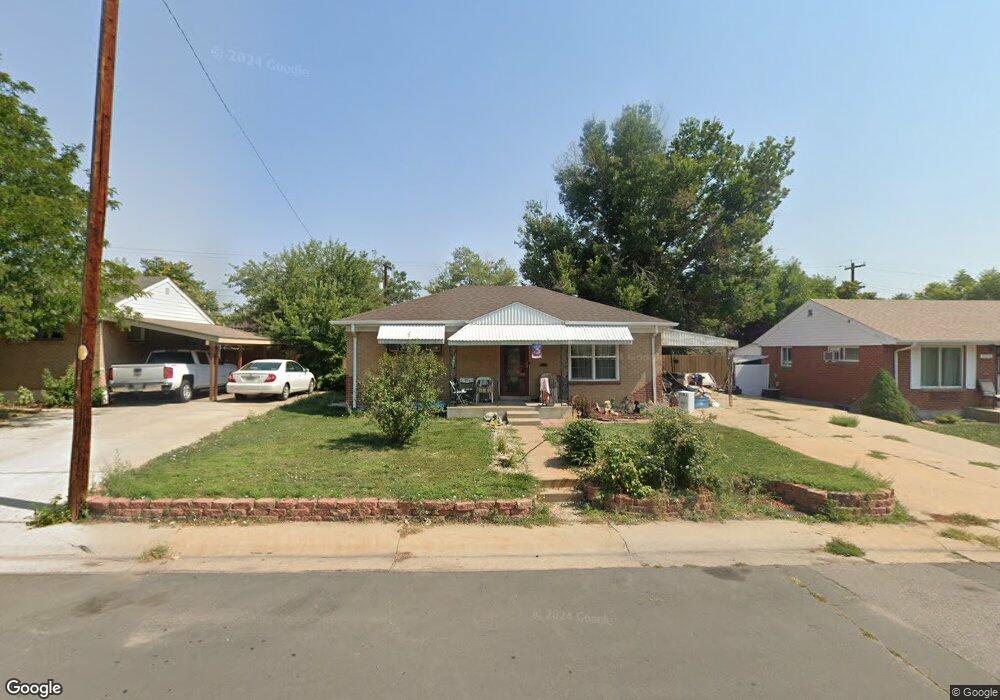
7508 Quivas St Denver, CO 80221
Sherrelwood NeighborhoodEstimated Value: $430,796 - $463,000
4
Beds
2
Baths
1,570
Sq Ft
$284/Sq Ft
Est. Value
About This Home
This home is located at 7508 Quivas St, Denver, CO 80221 and is currently estimated at $445,699, approximately $283 per square foot. 7508 Quivas St is a home located in Adams County with nearby schools including Metropolitan Arts Academy, Iver C. Ranum Middle School, and Westminster High School.
Ownership History
Date
Name
Owned For
Owner Type
Purchase Details
Closed on
Aug 17, 2000
Sold by
Ohlemacher Paula J
Bought by
Garcia Ron and Garcia Elvira
Current Estimated Value
Home Financials for this Owner
Home Financials are based on the most recent Mortgage that was taken out on this home.
Original Mortgage
$168,511
Outstanding Balance
$57,399
Interest Rate
8.15%
Mortgage Type
FHA
Estimated Equity
$388,300
Purchase Details
Closed on
Mar 19, 1996
Sold by
Ohlemacher James A
Bought by
Ohlemacher Paula J
Home Financials for this Owner
Home Financials are based on the most recent Mortgage that was taken out on this home.
Original Mortgage
$87,000
Interest Rate
7.35%
Purchase Details
Closed on
Oct 25, 1995
Sold by
Ohlemacher James A and Ohlemacher Paula J
Bought by
Ohlemacher James A
Purchase Details
Closed on
Jul 17, 1991
Create a Home Valuation Report for This Property
The Home Valuation Report is an in-depth analysis detailing your home's value as well as a comparison with similar homes in the area
Home Values in the Area
Average Home Value in this Area
Purchase History
| Date | Buyer | Sale Price | Title Company |
|---|---|---|---|
| Garcia Ron | $169,900 | -- | |
| Ohlemacher Paula J | -- | -- | |
| Ohlemacher James A | -- | -- | |
| -- | $64,000 | -- |
Source: Public Records
Mortgage History
| Date | Status | Borrower | Loan Amount |
|---|---|---|---|
| Open | Garcia Ron | $168,511 | |
| Previous Owner | Ohlemacher Paula J | $87,000 |
Source: Public Records
Tax History
| Year | Tax Paid | Tax Assessment Tax Assessment Total Assessment is a certain percentage of the fair market value that is determined by local assessors to be the total taxable value of land and additions on the property. | Land | Improvement |
|---|---|---|---|---|
| 2025 | $3,433 | $31,760 | $6,120 | $25,640 |
| 2024 | $3,433 | $29,190 | $5,630 | $23,560 |
| 2023 | $3,334 | $32,600 | $5,610 | $26,990 |
| 2022 | $2,876 | $23,480 | $5,770 | $17,710 |
| 2021 | $2,999 | $23,480 | $5,770 | $17,710 |
| 2020 | $2,821 | $22,960 | $5,790 | $17,170 |
| 2019 | $2,811 | $22,960 | $5,790 | $17,170 |
| 2018 | $2,295 | $17,930 | $5,620 | $12,310 |
| 2017 | $2,022 | $17,930 | $5,620 | $12,310 |
| 2016 | $1,869 | $15,600 | $2,710 | $12,890 |
| 2015 | $1,865 | $15,600 | $2,710 | $12,890 |
| 2014 | $1,685 | $14,010 | $2,230 | $11,780 |
Source: Public Records
Map
Nearby Homes
- 7488 Quivas St
- 1281 Mariposa Dr
- 7798 Quivas St
- 1665 Elmwood Ln
- 7831 Shoshone St
- 1181 El Paso Blvd
- 1262 Elder St
- 7889 Pecos St
- 7426 Skyline Dr
- 7911 Navajo St
- 2513 W 74th Ave
- 7883 Greenwood Blvd
- 2420 Cottonwood Dr
- 7956 Osage St
- 841 Bronco Rd
- 2500 Westchester Dr
- 781 Cortez St
- 7050 Alan Dr
- 7652 Granada Rd
- 820 Bronco Rd
Your Personal Tour Guide
Ask me questions while you tour the home.