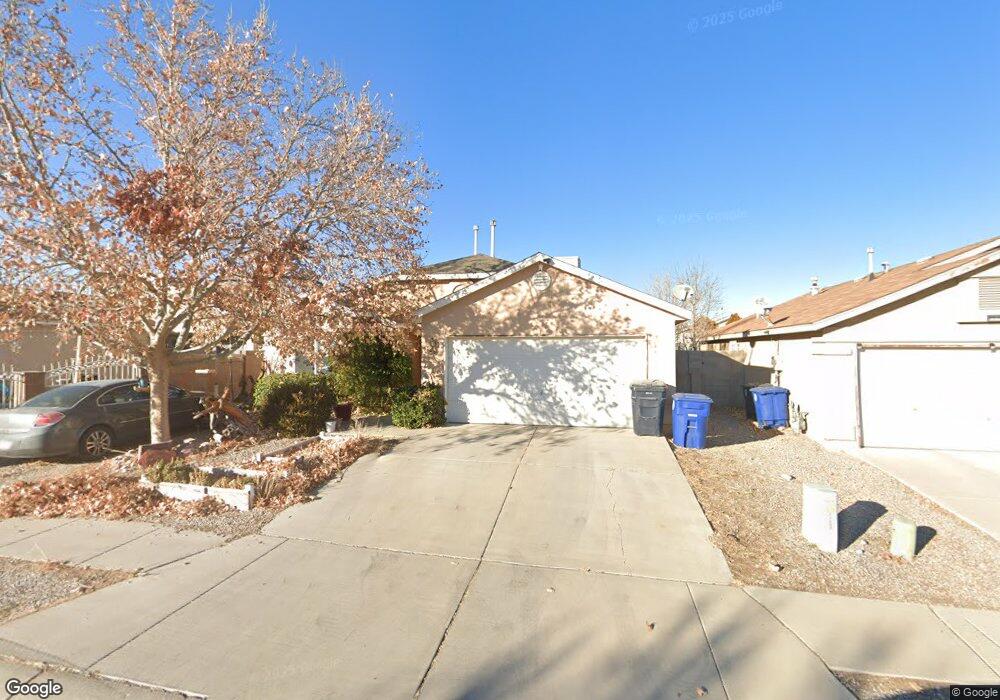
7509 Autumn Sky Rd SW Albuquerque, NM 87121
Southwest Heights NeighborhoodEstimated Value: $272,000 - $293,000
3
Beds
2
Baths
1,552
Sq Ft
$181/Sq Ft
Est. Value
About This Home
This home is located at 7509 Autumn Sky Rd SW, Albuquerque, NM 87121 and is currently estimated at $281,081, approximately $181 per square foot. 7509 Autumn Sky Rd SW is a home located in Bernalillo County with nearby schools including Maryann Binford Elementary School, Truman Middle School, and Rio Grande High School.
Ownership History
Date
Name
Owned For
Owner Type
Purchase Details
Closed on
May 2, 2011
Sold by
Bencomo Esteban
Bought by
Bencomo Esteban and Bencomo Silvia Munoz
Current Estimated Value
Home Financials for this Owner
Home Financials are based on the most recent Mortgage that was taken out on this home.
Original Mortgage
$81,500
Outstanding Balance
$4,387
Interest Rate
4.82%
Mortgage Type
New Conventional
Estimated Equity
$276,694
Purchase Details
Closed on
Nov 8, 2000
Sold by
Bencomo Esteban and Debencomo Silvia Munoz
Bought by
Bencomo Esteban
Purchase Details
Closed on
Sep 28, 2000
Sold by
Big Creek Ltd Partnership
Bought by
Artistic Homes Inc
Purchase Details
Closed on
Sep 26, 2000
Sold by
Curb Inc
Bought by
Big Creek Ltd Partnership
Create a Home Valuation Report for This Property
The Home Valuation Report is an in-depth analysis detailing your home's value as well as a comparison with similar homes in the area
Home Values in the Area
Average Home Value in this Area
Purchase History
| Date | Buyer | Sale Price | Title Company |
|---|---|---|---|
| Bencomo Esteban | -- | Fidelity National Title Nm | |
| Bencomo Esteban | -- | First American Title Co | |
| Bencomo Esteban | -- | First American Title Co | |
| Artistic Homes Inc | -- | First American Title Co | |
| Big Creek Ltd Partnership | -- | First American Title Co |
Source: Public Records
Mortgage History
| Date | Status | Borrower | Loan Amount |
|---|---|---|---|
| Open | Bencomo Esteban | $81,500 |
Source: Public Records
Tax History Compared to Growth
Tax History
| Year | Tax Paid | Tax Assessment Tax Assessment Total Assessment is a certain percentage of the fair market value that is determined by local assessors to be the total taxable value of land and additions on the property. | Land | Improvement |
|---|---|---|---|---|
| 2025 | $3,694 | $45,103 | $12,226 | $32,877 |
| 2024 | $3,694 | $43,789 | $11,870 | $31,919 |
| 2023 | $2,800 | $42,515 | $11,525 | $30,990 |
| 2022 | $1,756 | $41,276 | $11,189 | $30,087 |
| 2021 | $1,697 | $40,075 | $10,864 | $29,211 |
| 2020 | $1,669 | $38,907 | $10,547 | $28,360 |
| 2019 | $1,620 | $37,775 | $10,240 | $27,535 |
| 2018 | $1,562 | $37,775 | $10,240 | $27,535 |
| 2017 | $1,514 | $36,675 | $9,942 | $26,733 |
| 2016 | $1,471 | $34,570 | $9,372 | $25,198 |
| 2015 | $33,563 | $33,563 | $9,099 | $24,464 |
| 2014 | $1,438 | $33,863 | $9,099 | $24,764 |
| 2013 | -- | $34,196 | $9,099 | $25,097 |
Source: Public Records
Map
Nearby Homes
- 7304 Autumn Sky Rd SW
- 1815 Shadetree Dr SW
- 1615 Quiet Desert Dr SW
- 7814 Desert Canyon Place SW
- 1420 Summerfield Place SW
- 7901 Purple Fringe Rd SW
- 7605 Windsong Place SW
- 2503 Sancho Panza Way SW
- 0 Sage Rd SW Unit 1085259
- 0 Nwq Unser and Sage SW Unit 1081546
- 8600 Kimela Ct SW
- 780 Jaconita Place SW
- 921 Roma Dora Ln
- 2012 Foothill Dr SW
- 2528 Coors Blvd SW
- 8709 Rhonda Ave SW
- Nutmeg Plan at Sage Park
- Bay Leaf Plan at Sage Park
- Cumin Plan at Sage Park
- Clove Plan at Sage Park
- 7505 Autumn Sky Rd SW
- 7515 Autumn Sky Rd SW
- 7501 Autumn Sky Rd SW
- 7601 Autumn Sky Rd SW
- 7508 Autumn Breeze Rd SW
- 7512 Autumn Breeze Rd SW
- 7504 Autumn Breeze Rd SW
- 7504 Autumn Sky Rd SW
- 7600 Autumn Breeze Rd SW
- 7415 Autumn Sky Rd SW
- 7605 Autumn Sky Rd SW
- 7508 Autumn Sky Rd SW
- 7500 Autumn Breeze Rd SW
- 7512 Autumn Sky Rd SW
- 7500 Autumn Sky Rd SW
- 7600 Autumn Sky Rd SW
- 7412 Autumn Breeze Rd SW
- 7604 Autumn Breeze Rd SW
- 7409 Autumn Sky Rd SW
- 7609 Autumn Sky Rd SW