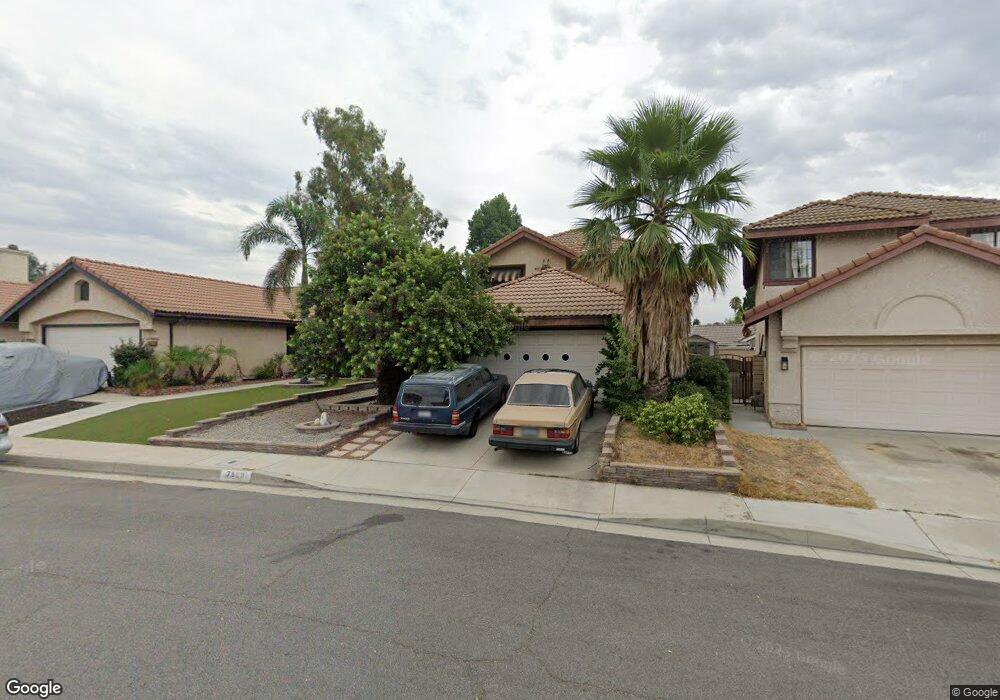
7509 Villa Crest Place Rancho Cucamonga, CA 91730
Terra Vista NeighborhoodEstimated Value: $682,490 - $721,000
3
Beds
2
Baths
1,420
Sq Ft
$496/Sq Ft
Est. Value
About This Home
This home is located at 7509 Villa Crest Place, Rancho Cucamonga, CA 91730 and is currently estimated at $704,123, approximately $495 per square foot. 7509 Villa Crest Place is a home located in San Bernardino County with nearby schools including Ruth Musser Middle, Coyote Canyon Elementary, and Rancho Cucamonga High School.
Ownership History
Date
Name
Owned For
Owner Type
Purchase Details
Closed on
Oct 27, 2011
Sold by
Gomez Ana B
Bought by
Bastow Jonathan D
Current Estimated Value
Home Financials for this Owner
Home Financials are based on the most recent Mortgage that was taken out on this home.
Original Mortgage
$126,000
Outstanding Balance
$49,658
Interest Rate
4.09%
Mortgage Type
New Conventional
Estimated Equity
$654,465
Purchase Details
Closed on
Oct 14, 2011
Sold by
Ehrenberg Dorothy J
Bought by
Bastow Jonathan D
Home Financials for this Owner
Home Financials are based on the most recent Mortgage that was taken out on this home.
Original Mortgage
$126,000
Outstanding Balance
$49,658
Interest Rate
4.09%
Mortgage Type
New Conventional
Estimated Equity
$654,465
Purchase Details
Closed on
Aug 3, 2000
Sold by
Ehrenberg Elliott
Bought by
Ehrenberg Elliott and Ehrenberg Dorothy J
Create a Home Valuation Report for This Property
The Home Valuation Report is an in-depth analysis detailing your home's value as well as a comparison with similar homes in the area
Home Values in the Area
Average Home Value in this Area
Purchase History
| Date | Buyer | Sale Price | Title Company |
|---|---|---|---|
| Bastow Jonathan D | -- | Southland Title Of Burbank | |
| Bastow Jonathan D | $220,000 | Southland Title Of Burbank | |
| Ehrenberg Dorothy J | -- | Southland Title Of Burbank | |
| Ehrenberg Elliott | -- | -- |
Source: Public Records
Mortgage History
| Date | Status | Borrower | Loan Amount |
|---|---|---|---|
| Open | Bastow Jonathan D | $126,000 |
Source: Public Records
Tax History Compared to Growth
Tax History
| Year | Tax Paid | Tax Assessment Tax Assessment Total Assessment is a certain percentage of the fair market value that is determined by local assessors to be the total taxable value of land and additions on the property. | Land | Improvement |
|---|---|---|---|---|
| 2025 | $3,567 | $276,333 | $69,084 | $207,249 |
| 2024 | $3,567 | $270,914 | $67,729 | $203,185 |
| 2023 | $3,470 | $265,602 | $66,401 | $199,201 |
| 2022 | $3,393 | $260,394 | $65,099 | $195,295 |
| 2021 | $3,391 | $255,289 | $63,823 | $191,466 |
| 2020 | $3,310 | $252,672 | $63,169 | $189,503 |
| 2019 | $3,296 | $247,717 | $61,930 | $185,787 |
| 2018 | $3,218 | $242,860 | $60,716 | $182,144 |
| 2017 | $3,169 | $238,098 | $59,525 | $178,573 |
| 2016 | $3,158 | $233,430 | $58,358 | $175,072 |
| 2015 | $3,119 | $229,923 | $57,481 | $172,442 |
| 2014 | $3,035 | $225,419 | $56,355 | $169,064 |
Source: Public Records
Map
Nearby Homes
- 10487 Balsa St
- 10627 Wildrose Dr
- 10669 Wildrose Dr
- 7314 Greenhaven Ave Unit 74
- 7355 Ambrosia Rd
- 7688 Gainey Ct
- 7718 Haywood Place
- 7208 Marine Ave
- 10591 Huxley Dr
- 7803 Paxton Place
- 10375 Church St Unit 113
- 10375 Church St Unit 74
- 10350 Base Line Rd
- 10350 Base Line Rd Unit 192
- 7224 Parkside Place
- 7175 Summerfield Place
- 10350 Baseline Rd Unit 173
- 10288 Effen St
- 7055 Mango St
- 10781 La Vine St
- 7503 Villa Crest Place
- 7523 Villa Crest Place
- 7495 Villa Crest Place
- 7524 Sierra Linda Ct
- 7510 Sierra Linda Ct
- 7502 Sierra Linda Ct
- 7487 Villa Crest Place
- 7498 Sierra Linda Ct
- 7508 Villa Crest Place
- 7502 Villa Crest Place
- 7492 Villa Crest Place
- 7490 Sierra Linda Ct
- 10531 Creekbridge St
- 7483 Villa Crest Place
- 7488 Villa Crest Place
- 10537 Creekbridge St
- 10525 Creekbridge St
- 10543 Creekbridge St
- 7486 Sierra Linda Ct
- 7484 Villa Crest Place