Estimated Value: $803,060 - $949,000
3
Beds
2
Baths
1,529
Sq Ft
$564/Sq Ft
Est. Value
About This Home
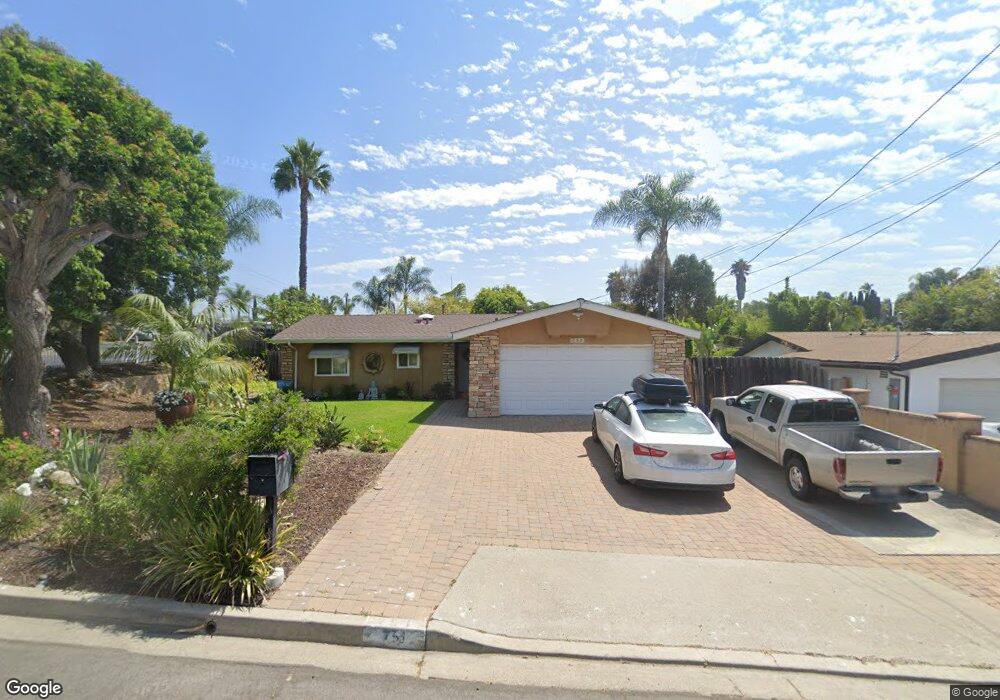
This home is located at 751 Galaxy Dr, Vista, CA 92083 and is currently estimated at $862,515, approximately $564 per square foot. 751 Galaxy Dr is a home located in San Diego County with nearby schools including Grapevine Elementary School, Madison Middle School, and Rancho Buena Vista High School.
Ownership History
Date
Name
Owned For
Owner Type
Purchase Details
Closed on
Feb 19, 2020
Sold by
Paz Alejandro
Bought by
Paz Alejandro and Alejandro Paz Trust
Current Estimated Value
Purchase Details
Closed on
Jun 9, 2016
Sold by
Tharp Teresa A and Paz Carmen P
Bought by
Paz Carmen P and Paz Victor M
Home Financials for this Owner
Home Financials are based on the most recent Mortgage that was taken out on this home.
Original Mortgage
$186,000
Outstanding Balance
$148,372
Interest Rate
3.64%
Mortgage Type
New Conventional
Estimated Equity
$714,143
Purchase Details
Closed on
Feb 3, 2011
Sold by
Paz Alejandro
Bought by
Tharp Theresa A
Home Financials for this Owner
Home Financials are based on the most recent Mortgage that was taken out on this home.
Original Mortgage
$200,000
Interest Rate
4.84%
Mortgage Type
New Conventional
Purchase Details
Closed on
Jan 6, 2011
Sold by
Pgi Investments Llc
Bought by
Tharp Teresa A and Paz Carmen P
Home Financials for this Owner
Home Financials are based on the most recent Mortgage that was taken out on this home.
Original Mortgage
$200,000
Interest Rate
4.84%
Mortgage Type
New Conventional
Purchase Details
Closed on
Aug 11, 2010
Sold by
Clark Lawrence and Clark Chandra
Bought by
Pgi Investments Llc
Purchase Details
Closed on
Mar 23, 2007
Sold by
Clark Lawrence and Clark Chandra
Bought by
Clark Lawrence and Clark Chandra
Home Financials for this Owner
Home Financials are based on the most recent Mortgage that was taken out on this home.
Original Mortgage
$385,000
Interest Rate
5.87%
Mortgage Type
New Conventional
Purchase Details
Closed on
May 18, 2004
Sold by
Moss James E and Moss Phyllis A
Bought by
Moss James E and Moss Phyllis A
Purchase Details
Closed on
Feb 27, 2004
Sold by
Clark Lawrence and Clark Chandra
Bought by
Clark Lawrence and Clark Chandra
Purchase Details
Closed on
Dec 20, 1999
Sold by
Kennington Steven H and Kennington Marjorie R
Bought by
Clark Lawrence and Clark Chandra
Home Financials for this Owner
Home Financials are based on the most recent Mortgage that was taken out on this home.
Original Mortgage
$90,000
Interest Rate
7.87%
Mortgage Type
Seller Take Back
Purchase Details
Closed on
Nov 8, 1999
Sold by
Investments Kennington Sheldon Cons & H & S 0 and Kennington Michelle
Bought by
Kennington Steven H and Kennington Marjorie R
Home Financials for this Owner
Home Financials are based on the most recent Mortgage that was taken out on this home.
Original Mortgage
$90,000
Interest Rate
7.87%
Mortgage Type
Seller Take Back
Purchase Details
Closed on
Jun 11, 1986
Create a Home Valuation Report for This Property
The Home Valuation Report is an in-depth analysis detailing your home's value as well as a comparison with similar homes in the area
Home Values in the Area
Average Home Value in this Area
Purchase History
| Date | Buyer | Sale Price | Title Company |
|---|---|---|---|
| Paz Alejandro | -- | None Available | |
| Paz Alejandro | -- | None Available | |
| Paz Carmen P | -- | Stewart Title Of Ca Inc | |
| Tharp Theresa A | -- | Orange Coast Title Co | |
| Paz Carmen | -- | Orange Coast Title Co | |
| Tharp Teresa A | $321,000 | Orange Coast Title Co | |
| Pgi Investments Llc | $230,400 | Orange Coast Title | |
| Clark Lawrence | -- | Commonwealth Title | |
| Clark Lawrence | -- | Commonwealth Title | |
| Moss James E | -- | -- | |
| Clark Lawrence | -- | -- | |
| Clark Lawrence | $100,000 | Chicago Title Co | |
| Kennington Steven H | -- | Chicago Title Co | |
| -- | $48,000 | -- |
Source: Public Records
Mortgage History
| Date | Status | Borrower | Loan Amount |
|---|---|---|---|
| Open | Paz Carmen P | $186,000 | |
| Closed | Tharp Teresa A | $200,000 | |
| Previous Owner | Clark Lawrence | $385,000 | |
| Previous Owner | Clark Lawrence | $90,000 |
Source: Public Records
Tax History
| Year | Tax Paid | Tax Assessment Tax Assessment Total Assessment is a certain percentage of the fair market value that is determined by local assessors to be the total taxable value of land and additions on the property. | Land | Improvement |
|---|---|---|---|---|
| 2025 | $6,137 | $502,167 | $312,863 | $189,304 |
| 2024 | $6,137 | $492,322 | $306,729 | $185,593 |
| 2023 | $6,008 | $482,669 | $300,715 | $181,954 |
| 2022 | $5,994 | $473,206 | $294,819 | $178,387 |
| 2021 | $5,773 | $455,684 | $268,050 | $187,634 |
| 2020 | $5,742 | $451,013 | $265,302 | $185,711 |
| 2019 | $5,662 | $442,170 | $260,100 | $182,070 |
| 2018 | $5,417 | $433,500 | $255,000 | $178,500 |
| 2017 | $5,330 | $425,000 | $250,000 | $175,000 |
| 2016 | $4,464 | $347,403 | $156,926 | $190,477 |
| 2015 | $4,440 | $342,185 | $154,569 | $187,616 |
| 2014 | $3,696 | $335,483 | $151,542 | $183,941 |
Source: Public Records
Map
Nearby Homes
- 702 Pecan Ct
- 1333 Olive Ave Unit 37
- 1333 Olive Ave Unit 60
- 4445 Sunburst Dr
- 675 Grant Ct
- 523 Hatherly St
- 1723 Wildflower Ct
- 323 Hill Dr
- 227 Hill Dr
- 264 Camellia Way
- 4142 Alana Cir
- 2839 Emerald Dr
- 4216 Esperanza Way
- 1925 Arroyo Ave
- 4129 Terry St
- 1019 Highland Dr
- 400 N Melrose Dr Unit SPC 40
- 1555 Acacia Cir Unit 1
- 4530 Beverly Glen Dr
- 4535 Golden Ridge Dr
Your Personal Tour Guide
Ask me questions while you tour the home.