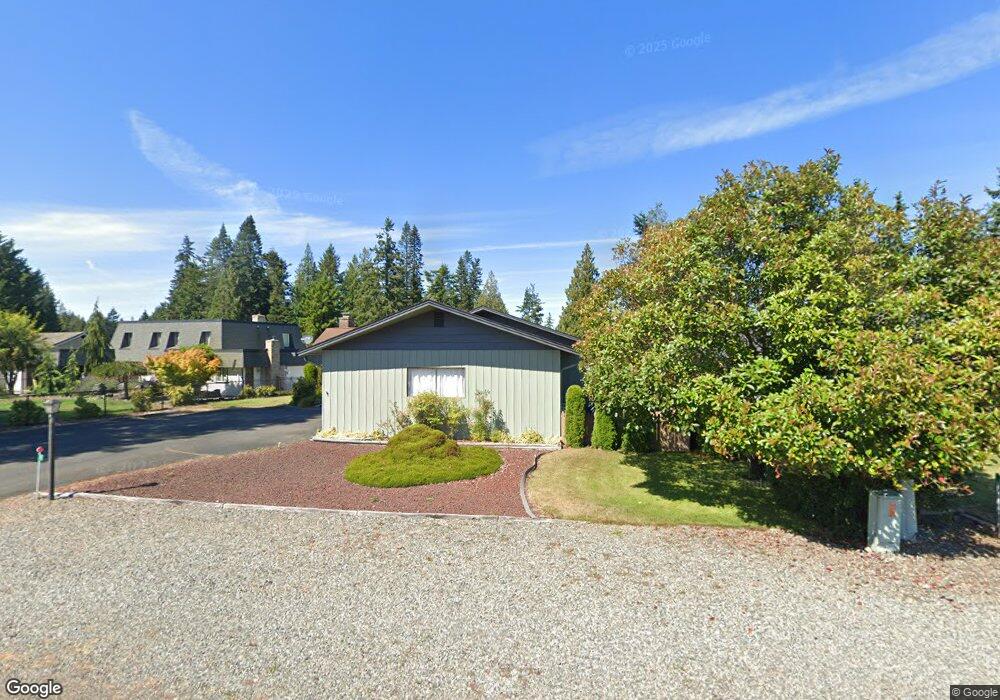
751 Medsker Rd Sequim, WA 98382
Estimated Value: $468,520 - $516,000
2
Beds
2
Baths
1,596
Sq Ft
$313/Sq Ft
Est. Value
About This Home
This home is located at 751 Medsker Rd, Sequim, WA 98382 and is currently estimated at $499,507, approximately $312 per square foot. 751 Medsker Rd is a home located in Clallam County with nearby schools including Helen Haller Elementary School, Sequim Middle School, and Sequim Senior High School.
Ownership History
Date
Name
Owned For
Owner Type
Purchase Details
Closed on
Feb 1, 2019
Sold by
Rice Craig and Robert J And Jane B Rice Trust
Bought by
Landers John and Landers Alexandra
Current Estimated Value
Home Financials for this Owner
Home Financials are based on the most recent Mortgage that was taken out on this home.
Original Mortgage
$150,000
Outstanding Balance
$131,877
Interest Rate
4.5%
Mortgage Type
New Conventional
Estimated Equity
$367,630
Purchase Details
Closed on
Aug 1, 2005
Sold by
Johnson Rita M
Bought by
Rice Jane B
Home Financials for this Owner
Home Financials are based on the most recent Mortgage that was taken out on this home.
Original Mortgage
$216,000
Interest Rate
5.62%
Mortgage Type
Adjustable Rate Mortgage/ARM
Create a Home Valuation Report for This Property
The Home Valuation Report is an in-depth analysis detailing your home's value as well as a comparison with similar homes in the area
Purchase History
| Date | Buyer | Sale Price | Title Company |
|---|---|---|---|
| Landers John | $287,500 | Clallam Title Co | |
| Rice Jane B | $270,000 | Olympic Peninsula Title Co |
Source: Public Records
Mortgage History
| Date | Status | Borrower | Loan Amount |
|---|---|---|---|
| Open | Landers John | $150,000 | |
| Previous Owner | Rice Jane B | $216,000 |
Source: Public Records
Tax History
| Year | Tax Paid | Tax Assessment Tax Assessment Total Assessment is a certain percentage of the fair market value that is determined by local assessors to be the total taxable value of land and additions on the property. | Land | Improvement |
|---|---|---|---|---|
| 2025 | $2,954 | $393,084 | $99,000 | $294,084 |
| 2023 | $2,954 | $399,623 | $99,000 | $300,623 |
| 2022 | $2,785 | $384,592 | $99,000 | $285,592 |
| 2021 | $2,466 | $267,140 | $75,178 | $191,962 |
| 2020 | $2,659 | $257,621 | $75,178 | $182,443 |
| 2018 | $677 | $251,554 | $75,178 | $176,376 |
| 2017 | $651 | $204,808 | $75,178 | $129,630 |
| 2016 | $645 | $204,161 | $75,178 | $128,983 |
| 2015 | $2,027 | $198,661 | $75,178 | $123,483 |
| 2013 | $2,027 | $175,257 | $75,178 | $100,079 |
| 2012 | $2,027 | $203,794 | $85,201 | $118,593 |
Source: Public Records
Map
Nearby Homes
- 117 Williams Place
- 213 Sunset Place
- 127 Sunrise View Ave
- 187 Sunland Dr
- 192 Sunset Place
- 181 Sunland Dr
- 296 Taylor Blvd
- 185 Fairway Dr
- 115 Fairway Dr
- 193 Fairway Dr
- 292 Foursome Dr
- 133 San Juan Dr
- 113 San Juan Dr
- 136 Sunset Place
- 290 Foursome Dr
- 109 Vancouver Place
- 126 Hilltop Dr Unit C
- 126 Hilltop Dr Unit C
- 190 San Juan Dr
- 111 Mount Baker Dr
Your Personal Tour Guide
Ask me questions while you tour the home.