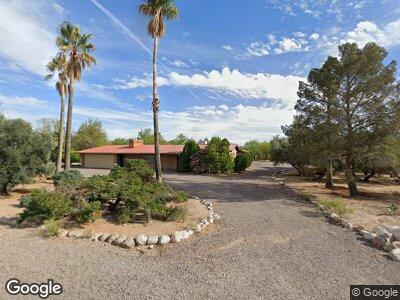
751 W Giaconda Way Tucson, AZ 85704
Estimated Value: $509,312 - $669,000
--
Bed
3
Baths
2,222
Sq Ft
$271/Sq Ft
Est. Value
About This Home
This home is located at 751 W Giaconda Way, Tucson, AZ 85704 and is currently estimated at $602,578, approximately $271 per square foot. 751 W Giaconda Way is a home located in Pima County with nearby schools including Winifred Harelson Elementary School, Cross Middle School, and Canyon Del Oro High School.
Ownership History
Date
Name
Owned For
Owner Type
Purchase Details
Closed on
Mar 25, 2024
Sold by
Revocable Trust For Frederic Norton Finn and Finney Family Trust
Bought by
Brady Heather Finney
Current Estimated Value
Purchase Details
Closed on
Nov 15, 2002
Sold by
Finney Frederic N and Finney Vera Brown
Bought by
Finney Frederic Norton
Home Financials for this Owner
Home Financials are based on the most recent Mortgage that was taken out on this home.
Original Mortgage
$75,500
Interest Rate
5.89%
Purchase Details
Closed on
Mar 16, 2001
Sold by
Finney Frederic N and Finney Vera B
Bought by
Finney Frederick Norton
Home Financials for this Owner
Home Financials are based on the most recent Mortgage that was taken out on this home.
Original Mortgage
$100,000
Interest Rate
6.97%
Purchase Details
Closed on
Mar 28, 1995
Sold by
Finney Frederic Norton and Finney Vera Marie
Bought by
Finney Frederic Norton
Create a Home Valuation Report for This Property
The Home Valuation Report is an in-depth analysis detailing your home's value as well as a comparison with similar homes in the area
Home Values in the Area
Average Home Value in this Area
Purchase History
| Date | Buyer | Sale Price | Title Company |
|---|---|---|---|
| Brady Heather Finney | -- | None Listed On Document | |
| Finney Frederic Norton | -- | -- | |
| Finney Frederic N | -- | Lawyers Title | |
| Finney Frederick Norton | -- | -- | |
| Finney Fredeick N | -- | -- | |
| Finney Frederic Norton | -- | -- |
Source: Public Records
Mortgage History
| Date | Status | Borrower | Loan Amount |
|---|---|---|---|
| Previous Owner | Finney Frederic N | $75,500 | |
| Previous Owner | Finney Fredeick N | $100,000 |
Source: Public Records
Tax History Compared to Growth
Tax History
| Year | Tax Paid | Tax Assessment Tax Assessment Total Assessment is a certain percentage of the fair market value that is determined by local assessors to be the total taxable value of land and additions on the property. | Land | Improvement |
|---|---|---|---|---|
| 2024 | $4,252 | $34,006 | -- | -- |
| 2023 | $4,252 | $32,387 | $0 | $0 |
| 2022 | $4,072 | $30,845 | $0 | $0 |
| 2021 | $3,997 | $27,977 | $0 | $0 |
| 2020 | $3,928 | $27,977 | $0 | $0 |
| 2019 | $3,808 | $27,023 | $0 | $0 |
| 2018 | $3,654 | $24,168 | $0 | $0 |
| 2017 | $3,598 | $24,168 | $0 | $0 |
| 2016 | $3,336 | $23,017 | $0 | $0 |
| 2015 | $3,228 | $21,921 | $0 | $0 |
Source: Public Records
Map
Nearby Homes
- 860 W Chula Vista Rd
- 710 W Burton Dr
- 6782 N Los Arboles Cir
- 6801 N Paseo de Los Altos
- 6859 N Placita Chula Vista
- 6651 N Paseo de Los Altos
- 945 W San Martin Dr
- 1220 W Giaconda Way
- 1222 W Placita San Nicolas
- 971 W White Acacia Place
- 1241 W Cananea Cir
- 180 W Greer Ln
- 6385 N Willowhaven Dr
- 6840 N Firenze Dr
- 6361 N Willowhaven Dr
- 7111 N Edgewood Place
- 471 W Yucca Ct Unit 314
- 471 W Yucca Ct Unit 313
- 7332 N Las Quintas Dr
- 1450 W Cerrada Colima
- 751 W Giaconda Way
- 731 W Giaconda Way
- 771 W Giaconda Way
- 6984 N Chula Vista Reserve Place
- 7020 N Via Assisi
- 6988 N Chula Vista Reserve Place
- 6992 N Chula Vista Reserve Place
- 701 W Giaconda Way
- 770 W Giaconda Way
- 791 W Giaconda Way
- 6980 N Chula Vista Reserve Place
- 6976 N Chula Vista Reserve Place Unit 7
- 702 W Giaconda Way
- 7111 N Via Venezia
- 7000 N Maria Place
- 7040 N Via Assisi
- 7025 N Via Assisi
- 681 W Giaconda Way
- 6998 N Chula Vista Reserve Place
- 811 W Giaconda Way