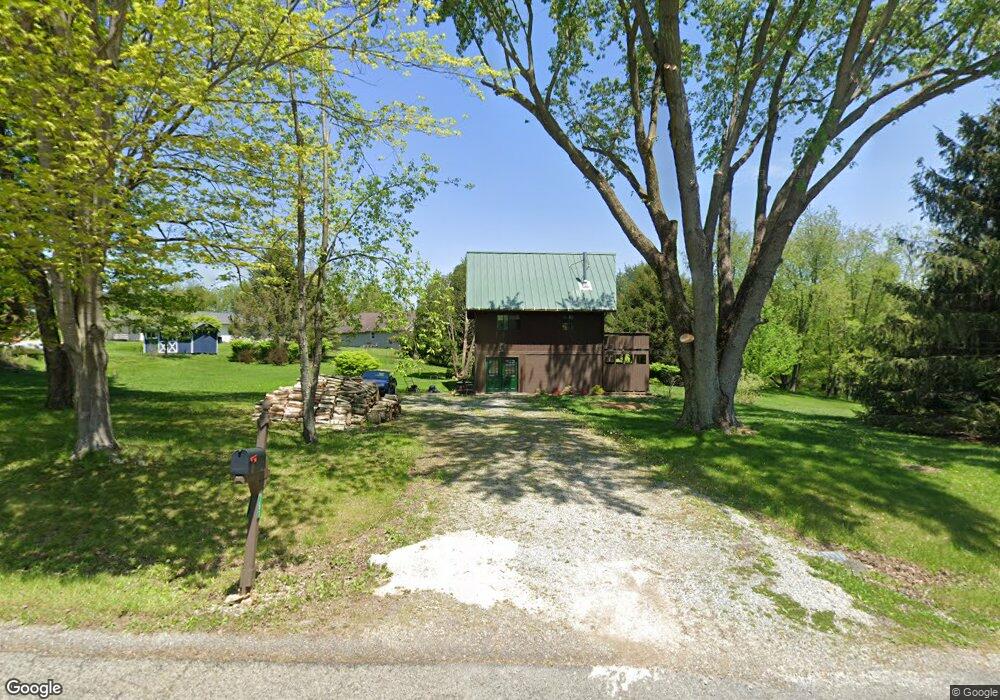
751 Winesap Cir Howard, OH 43028
Apple Valley NeighborhoodEstimated Value: $175,000 - $192,000
2
Beds
2
Baths
781
Sq Ft
$236/Sq Ft
Est. Value
About This Home
This home is located at 751 Winesap Cir, Howard, OH 43028 and is currently estimated at $184,462, approximately $236 per square foot. 751 Winesap Cir is a home located in Knox County with nearby schools including East Knox Elementary School and East Knox High School.
Ownership History
Date
Name
Owned For
Owner Type
Purchase Details
Closed on
Jul 24, 2006
Sold by
Wells Fargo Bank Na
Bought by
Bowden John R
Current Estimated Value
Home Financials for this Owner
Home Financials are based on the most recent Mortgage that was taken out on this home.
Original Mortgage
$89,300
Outstanding Balance
$53,540
Interest Rate
6.83%
Mortgage Type
New Conventional
Estimated Equity
$130,922
Purchase Details
Closed on
Jul 12, 2006
Sold by
Rinard Richard L
Bought by
Wells Fargo Bank Na
Home Financials for this Owner
Home Financials are based on the most recent Mortgage that was taken out on this home.
Original Mortgage
$89,300
Outstanding Balance
$53,540
Interest Rate
6.83%
Mortgage Type
New Conventional
Estimated Equity
$130,922
Purchase Details
Closed on
Jun 22, 2004
Sold by
Martin Dennis L and Martin Jennife
Bought by
Rinard Richard L
Purchase Details
Closed on
Jul 8, 1996
Sold by
Stevens Andre Vatke and Stevens Kel
Bought by
Martin Dennis L and Martin Jennife
Purchase Details
Closed on
May 2, 1995
Sold by
Mullendore Seth A
Bought by
Stevens Andre Vatke and Stevens Kel
Purchase Details
Closed on
Jan 4, 1995
Sold by
Mcdermott Del M and Mcdermott Joann K
Bought by
Mullendore Seth A
Purchase Details
Closed on
May 17, 1989
Sold by
Kerr Thomas J and Kerr Donn
Bought by
Mcdermott Del M and Mcdermott Joann K
Create a Home Valuation Report for This Property
The Home Valuation Report is an in-depth analysis detailing your home's value as well as a comparison with similar homes in the area
Home Values in the Area
Average Home Value in this Area
Purchase History
| Date | Buyer | Sale Price | Title Company |
|---|---|---|---|
| Bowden John R | $70,500 | None Available | |
| Wells Fargo Bank Na | $95,200 | None Available | |
| Rinard Richard L | $96,000 | -- | |
| Martin Dennis L | $59,900 | -- | |
| Stevens Andre Vatke | $58,500 | -- | |
| Mullendore Seth A | $43,000 | -- | |
| Mcdermott Del M | $34,000 | -- |
Source: Public Records
Mortgage History
| Date | Status | Borrower | Loan Amount |
|---|---|---|---|
| Open | Bowden John R | $89,300 | |
| Closed | Wells Fargo Bank Na | $89,300 |
Source: Public Records
Tax History
| Year | Tax Paid | Tax Assessment Tax Assessment Total Assessment is a certain percentage of the fair market value that is determined by local assessors to be the total taxable value of land and additions on the property. | Land | Improvement |
|---|---|---|---|---|
| 2024 | $1,589 | $39,650 | $3,370 | $36,280 |
| 2023 | $1,602 | $39,650 | $3,370 | $36,280 |
| 2022 | $1,291 | $27,350 | $2,330 | $25,020 |
| 2021 | $1,291 | $27,350 | $2,330 | $25,020 |
| 2020 | $1,230 | $27,350 | $2,330 | $25,020 |
| 2019 | $1,156 | $23,570 | $3,040 | $20,530 |
| 2018 | $1,084 | $23,570 | $3,040 | $20,530 |
| 2017 | $1,074 | $23,570 | $3,040 | $20,530 |
| 2016 | $1,011 | $21,830 | $2,820 | $19,010 |
| 2015 | $921 | $21,830 | $2,820 | $19,010 |
| 2014 | $922 | $21,830 | $2,820 | $19,010 |
| 2013 | $1,027 | $23,060 | $3,440 | $19,620 |
Source: Public Records
Map
Nearby Homes
- 770 Winesap Cir
- 531 Crabapple Dr
- Lots 392 & 393 Lakeview Heights Dr
- 0 Northern Spy Dr Unit 226000222
- 50 Orchard Hills Ct
- 63 Appleseed Ct
- 11 Crabtree Ct
- 48 Mcintosh Ct
- 0 Mcintosh Ct Unit 20250846
- 0 Mcintosh Ct Unit LOT 321
- 4006 Apple Valley Dr
- 31 Apple Valley Blvd
- 4045 Apple Valley Dr Unit LOT 10
- 4045 Apple Valley Dr
- 4053 Apple Valley Dr
- 0 Apple Valley Dr Unit 225009912
- 0 Apple Valley Dr Unit 5159791
- 0 Apple Valley Dr Unit 9069389
- 0 Apple Valley Dr Unit 20260049
- 21311 Coshocton Rd
- 763 Winesap Cir
- 123 Jonathon Dr
- 471 Winesap Cir
- 743 Winesap Cir
- 119 Jonathon Dr
- 750 Winesap Cir
- 754 Winesap Cir
- 135 Jonathon Dr
- 758 Winesap Cir
- 739 Winesap Cir
- 762 Winesap Cir
- 135 Jonathan Dr
- 735 Winesap Cir
- 108 Johnthon Dr
- 116 Jonathan Dr
- 108 Jonathon Dr
- 120 Jonathan Dr
- 120 Jonathon Dr
- 116 Jonathon Dr
- 104 Jonathon Dr
Your Personal Tour Guide
Ask me questions while you tour the home.