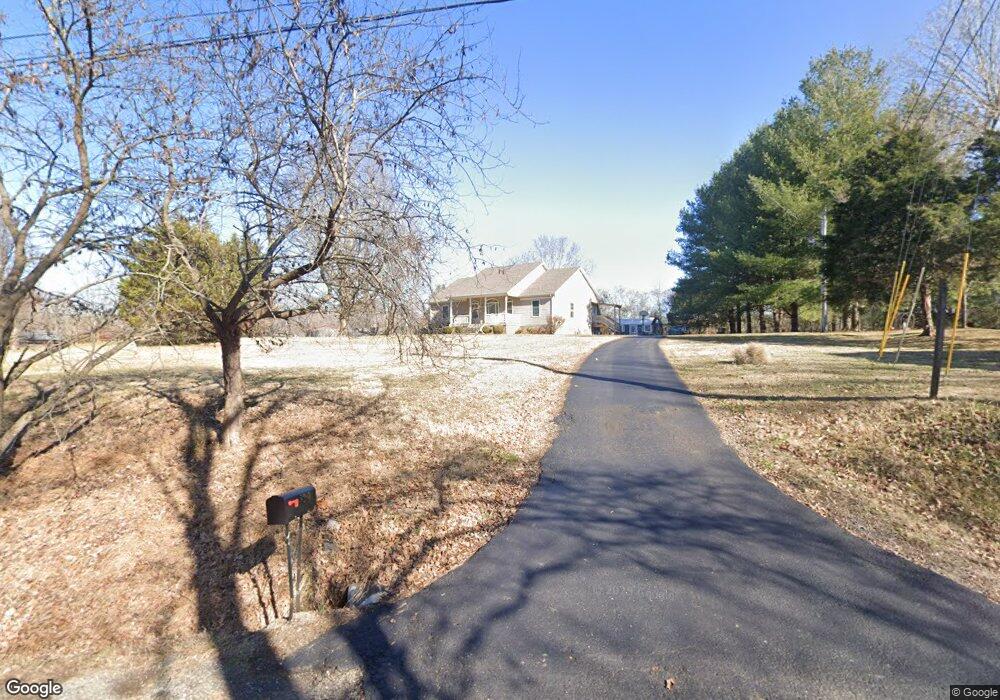
7510 Covington Rd White House, TN 37188
Estimated Value: $368,490 - $439,000
--
Bed
2
Baths
1,734
Sq Ft
$239/Sq Ft
Est. Value
About This Home
This home is located at 7510 Covington Rd, White House, TN 37188 and is currently estimated at $414,623, approximately $239 per square foot. 7510 Covington Rd is a home located in Robertson County with nearby schools including Robert F. Woodall Elementary School, White House Heritage Elementary School, and White House Heritage High School.
Ownership History
Date
Name
Owned For
Owner Type
Purchase Details
Closed on
Feb 11, 2020
Sold by
Coffey Matthew B
Bought by
Coffey Patricia L
Current Estimated Value
Home Financials for this Owner
Home Financials are based on the most recent Mortgage that was taken out on this home.
Original Mortgage
$196,000
Outstanding Balance
$173,544
Interest Rate
3.6%
Mortgage Type
New Conventional
Estimated Equity
$241,079
Purchase Details
Closed on
Mar 2, 2009
Sold by
Thompson Loretta
Bought by
Coffey Matthew B
Purchase Details
Closed on
Feb 21, 2002
Sold by
Stone Angelia D
Bought by
Loretta Thompson
Home Financials for this Owner
Home Financials are based on the most recent Mortgage that was taken out on this home.
Original Mortgage
$22,200
Interest Rate
6.95%
Purchase Details
Closed on
Apr 30, 1998
Purchase Details
Closed on
Mar 23, 1992
Bought by
Ellis Robert E
Create a Home Valuation Report for This Property
The Home Valuation Report is an in-depth analysis detailing your home's value as well as a comparison with similar homes in the area
Home Values in the Area
Average Home Value in this Area
Purchase History
| Date | Buyer | Sale Price | Title Company |
|---|---|---|---|
| Coffey Patricia L | -- | Wagon Wheel T&E Llc | |
| Coffey Matthew B | -- | -- | |
| Loretta Thompson | $31,000 | -- | |
| -- | $18,000 | -- | |
| Ellis Robert E | -- | -- |
Source: Public Records
Mortgage History
| Date | Status | Borrower | Loan Amount |
|---|---|---|---|
| Open | Coffey Patricia L | $196,000 | |
| Previous Owner | Ellis Robert E | $22,200 |
Source: Public Records
Tax History Compared to Growth
Tax History
| Year | Tax Paid | Tax Assessment Tax Assessment Total Assessment is a certain percentage of the fair market value that is determined by local assessors to be the total taxable value of land and additions on the property. | Land | Improvement |
|---|---|---|---|---|
| 2024 | $1,408 | $78,225 | $13,750 | $64,475 |
| 2023 | $1,408 | $78,225 | $13,750 | $64,475 |
| 2022 | $1,469 | $57,025 | $7,200 | $49,825 |
| 2021 | $1,469 | $57,025 | $7,200 | $49,825 |
| 2020 | $1,469 | $57,025 | $7,200 | $49,825 |
| 2019 | $1,469 | $57,025 | $7,200 | $49,825 |
| 2018 | $1,469 | $57,025 | $7,200 | $49,825 |
| 2017 | $1,469 | $47,625 | $5,450 | $42,175 |
| 2016 | $1,447 | $47,625 | $5,450 | $42,175 |
| 2015 | $1,388 | $46,900 | $5,450 | $41,450 |
| 2014 | $1,388 | $46,900 | $5,450 | $41,450 |
Source: Public Records
Map
Nearby Homes
- 4037 Weston Dr
- 8927 Covington Rd
- 8903 Covington Rd
- 8919 Covington Rd
- 3978 Bilbrey Dr
- 7452 Chowning Rd
- 0 Woodrow Wilson Rd
- 6723 Japonica Ln
- 6721 Japonica Ln
- 6623 Japonica Ln
- 6719 Japonica Ln
- 6731 Japonica Ln
- 6698 Japonica Ln
- 6710 Japonica Ln
- 6585 Japonica Ln
- 1104 Camelia Dr
- 6565 Japonica Ln
- 1050 Camelia Dr
- 1047 Camelia Dr
- 6555 Japonica Ln
- 7514 Covington Rd
- 2032 Blake Ln
- 7442 Covington Rd
- 7467 Covington Rd
- 2000 Summer Ct
- 7526 Covington Rd
- 2026 Blake Ln
- 7448 Covington Rd
- 2024 Blake Ln
- 7937 Cross Plains Rd
- 7436 Covington Rd
- 2029 Blake Ln
- 7542 Covington Rd
- 3066 Nobles Way
- 3066 Nobles Way
- 4445 Blake Ln
- 7850 Cross Plains Rd
- 2022 Blake Ln
- 2027 Blake Ln
- 1005 Summer Ct