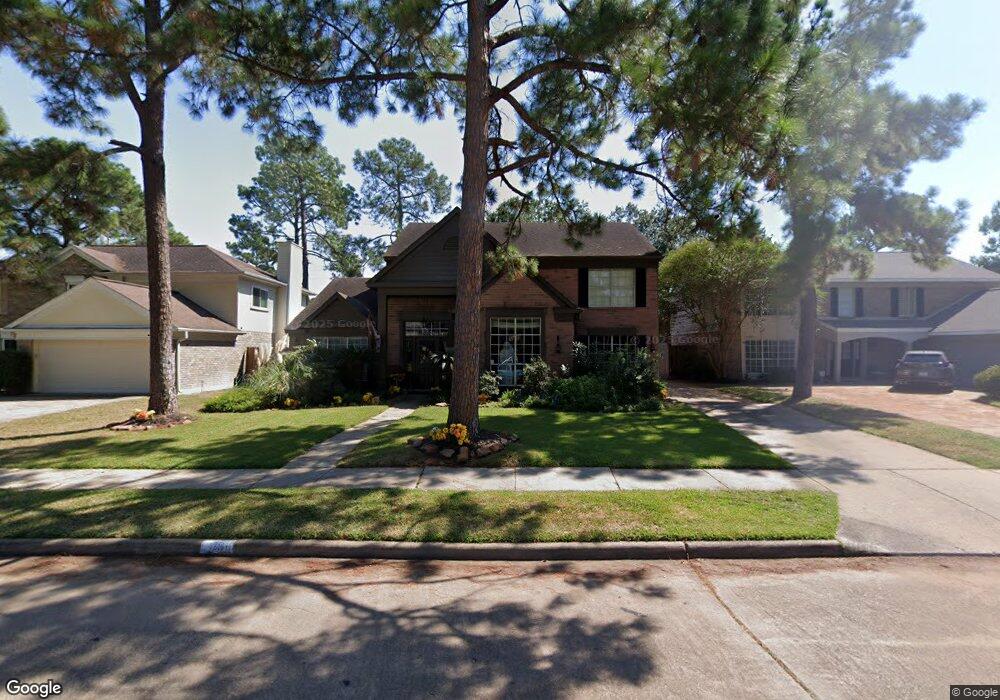
7510 Magnolia Shadows Ln Houston, TX 77095
Copperfield NeighborhoodEstimated Value: $338,000 - $359,000
4
Beds
3
Baths
2,580
Sq Ft
$135/Sq Ft
Est. Value
About This Home
This home is located at 7510 Magnolia Shadows Ln, Houston, TX 77095 and is currently estimated at $348,321, approximately $135 per square foot. 7510 Magnolia Shadows Ln is a home located in Harris County with nearby schools including Lowery Elementary School, Aragon Middle School, and Langham Creek High School.
Ownership History
Date
Name
Owned For
Owner Type
Purchase Details
Closed on
Aug 15, 2013
Sold by
List Bruce and List Sherry
Bought by
List Christopher L
Current Estimated Value
Purchase Details
Closed on
Jan 13, 2012
Sold by
Rinker Howell Lynda
Bought by
List Bruce and List Sherry
Purchase Details
Closed on
May 31, 2006
Sold by
Pantoja Tina and Pantoja Michael
Bought by
Stone William R
Purchase Details
Closed on
Jan 30, 2003
Sold by
Hagner Robert C
Bought by
Pantoja Michael and Pantoja Tina
Home Financials for this Owner
Home Financials are based on the most recent Mortgage that was taken out on this home.
Original Mortgage
$145,000
Interest Rate
5.96%
Create a Home Valuation Report for This Property
The Home Valuation Report is an in-depth analysis detailing your home's value as well as a comparison with similar homes in the area
Home Values in the Area
Average Home Value in this Area
Purchase History
| Date | Buyer | Sale Price | Title Company |
|---|---|---|---|
| List Christopher L | -- | None Available | |
| List Bruce | -- | Startex Title Co | |
| Stone William R | -- | First American Title | |
| Pantoja Michael | -- | Charter Title Company |
Source: Public Records
Mortgage History
| Date | Status | Borrower | Loan Amount |
|---|---|---|---|
| Previous Owner | Pantoja Michael | $145,000 |
Source: Public Records
Tax History Compared to Growth
Tax History
| Year | Tax Paid | Tax Assessment Tax Assessment Total Assessment is a certain percentage of the fair market value that is determined by local assessors to be the total taxable value of land and additions on the property. | Land | Improvement |
|---|---|---|---|---|
| 2025 | $4,580 | $305,000 | $75,819 | $229,181 |
| 2024 | $4,580 | $311,880 | $65,930 | $245,950 |
| 2023 | $4,580 | $316,024 | $65,930 | $250,094 |
| 2022 | $5,918 | $277,252 | $46,975 | $230,277 |
| 2021 | $5,686 | $224,125 | $46,975 | $177,150 |
| 2020 | $5,419 | $207,039 | $39,146 | $167,893 |
| 2019 | $5,735 | $223,247 | $39,146 | $184,101 |
| 2018 | $1,862 | $192,872 | $39,146 | $153,726 |
| 2017 | $5,234 | $192,872 | $39,146 | $153,726 |
| 2016 | $5,234 | $207,023 | $39,146 | $167,877 |
| 2015 | $4,029 | $194,937 | $39,146 | $155,791 |
| 2014 | $4,029 | $179,005 | $34,201 | $144,804 |
Source: Public Records
Map
Nearby Homes
- 7607 Plumtree Forest Cir
- 7519 Sunlight Ln
- 16734 Pebbleglen Dr
- 16502 Rainbow Lake Rd
- 16911 Shady Square Ct
- 7311 Barton Oaks Dr
- 7306 Bubbling Brooks Ln
- 7719 Woodlett Ct
- 7254 Sonnet Glen Ln
- 7307 Sunlight Ln
- 16346 Pebbleglen Dr
- 17010 Poplar Hill St
- 7539 Wildwood Brook Ct
- 7215 Daylight Ln
- 7311 Postwick Ct
- 16331 Dew Drop Ln
- 7511 Marble Glen Ln
- 16902 Terrace Park Dr
- 17222 Crown Meadow Ct
- 17206 Haley Falls Ln
- 7506 Magnolia Shadows Ln
- 7514 Magnolia Shadows Ln
- 16610 April Hill St
- 7502 Magnolia Shadows Ln
- 7523 Plumtree Forest Ct
- 7515 Magnolia Shadows Ln
- 7511 Magnolia Shadows Ln
- 7519 Plumtree Forest Ct
- 16606 April Hill St
- 7507 Magnolia Shadows Ln
- 7518 Magnolia Shadows Ln
- 7515 Plumtree Forest Ct
- 7503 Magnolia Shadows Ln
- 7519 Magnolia Shadows Ln
- 7418 Magnolia Shadows Ln
- 7511 Plumtree Forest Ct
- 7603 Plumtree Forest Cir
- 7522 Magnolia Shadows Ln
- 7514 Shangrila Ln
- 7510 Shangrila Ln