
Seller's Agent in 2018
Peter Stopulos
NAI Ruhl Commercial Company
(563) 823-5118
3 in this area
10 Total Sales
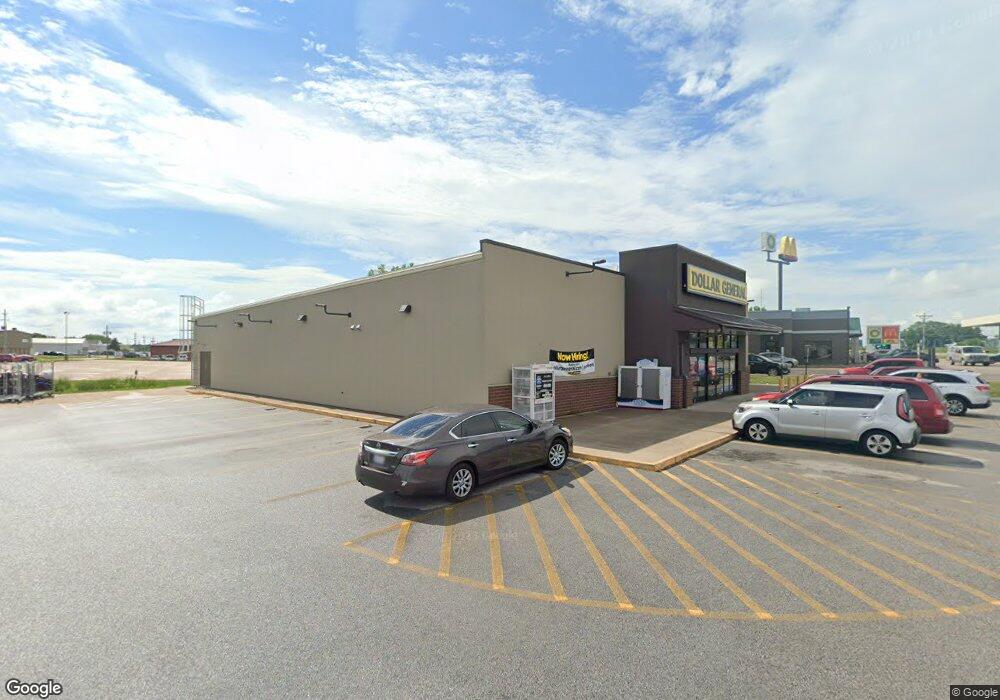
This home is located at 7510 Northwest Blvd, Davenport, IA 52806 since 24 June 2017. 7510 Northwest Blvd is a home located in Scott County with nearby schools including Cumberland Hall School, Academy Of Continuing Education, and Wood Intermediate School.
Last Agent to Sell the Property
NAI Ruhl Commercial Company License #S44257000 Listed on: 06/24/2017
Last Buyer's Agent
NON MLS
NON-MLS QCAR License #000.00000
| Date | Event | Price | List to Sale | Price per Sq Ft |
|---|---|---|---|---|
| 05/07/2018 05/07/18 | Sold | $250,000 | 0.0% | -- |
| 08/18/2017 08/18/17 | Pending | -- | -- | -- |
| 06/24/2017 06/24/17 | For Sale | $250,000 | -- | -- |
| Year | Tax Paid | Tax Assessment Tax Assessment Total Assessment is a certain percentage of the fair market value that is determined by local assessors to be the total taxable value of land and additions on the property. | Land | Improvement |
|---|---|---|---|---|
| 2025 | $30,994 | $1,029,630 | $250,690 | $778,940 |
| 2024 | $30,894 | $984,920 | $250,690 | $734,230 |
| 2023 | $25,496 | $984,920 | $250,690 | $734,230 |
| 2022 | $25,018 | $783,730 | $250,690 | $533,040 |
| 2021 | $25,018 | $783,730 | $250,690 | $533,040 |
| 2020 | $24,794 | $783,730 | $250,690 | $533,040 |
| 2019 | $5,236 | $233,390 | $233,390 | $0 |
| 2018 | $5,126 | $233,390 | $233,390 | $0 |
| 2017 | $5,306 | $233,390 | $233,390 | $0 |
| 2016 | $3,140 | $143,400 | $0 | $0 |
| 2015 | $3,140 | $143,400 | $0 | $0 |
| 2014 | $3,184 | $143,400 | $0 | $0 |
| 2013 | $4,496 | $0 | $0 | $0 |
| 2012 | -- | $143,400 | $143,400 | $0 |
Seller's Agent in 2018
Peter Stopulos
NAI Ruhl Commercial Company
(563) 823-5118
3 in this area
10 Total Sales
N
Buyer's Agent in 2018
NON MLS
NON-MLS QCAR
Source: RMLS Alliance
MLS Number: RMAQC7037664
APN: W0405B03
Disclaimer: Certain information contained herein is derived from information provided by parties other than Homes.com. All information provided is deemed reliable, but is not guaranteed to be accurate and should be independently verified.
![]() IDX information is provided exclusively for personal, non-commercial use, and may not be used for any purpose other than to identify prospective properties consumers may be interested in purchasing. Information is deemed reliable but not guaranteed.
IDX information is provided exclusively for personal, non-commercial use, and may not be used for any purpose other than to identify prospective properties consumers may be interested in purchasing. Information is deemed reliable but not guaranteed.