7511 Main St Flushing, NY 11367
Kew Gardens Hills NeighborhoodEstimated Value: $4,274,237
Studio
--
Bath
7,000
Sq Ft
$611/Sq Ft
Est. Value
About This Home
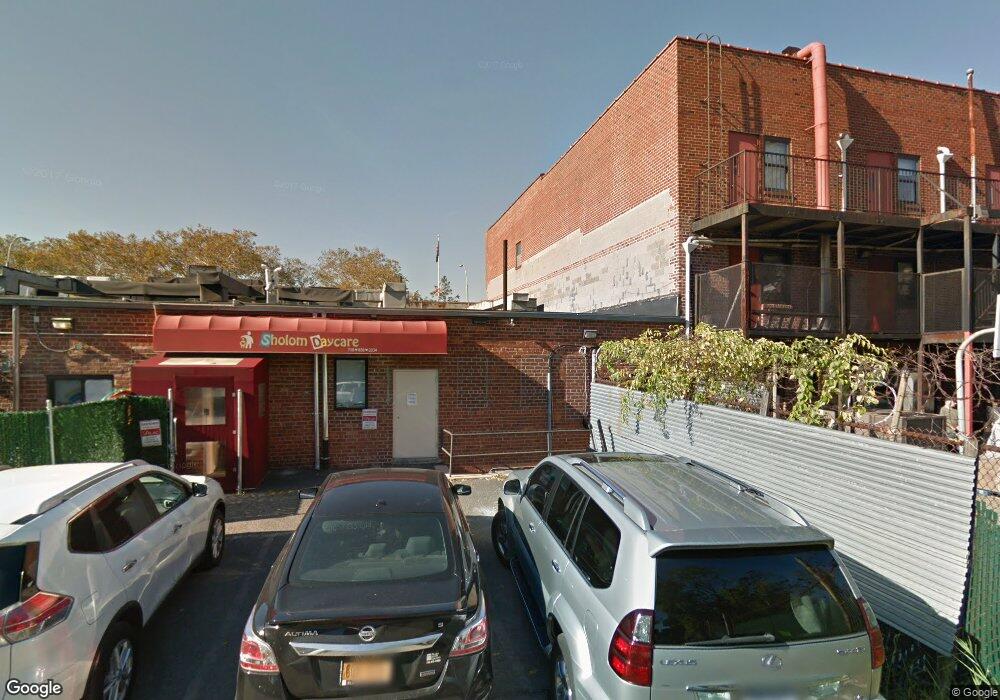
This home is located at 7511 Main St, Flushing, NY 11367 and is currently estimated at $4,274,237, approximately $610 per square foot. 7511 Main St is a home located in Queens County with nearby schools including P.S. 164 - Queens Valley, I.S. 250 - The Robert F. Kennedy Community Middle School, and Solomon Schechter School of Queens.
Ownership History
Date
Name
Owned For
Owner Type
Purchase Details
Closed on
Aug 31, 2009
Sold by
548 Management Corp
Bought by
United Assets Llc
Current Estimated Value
Purchase Details
Closed on
Mar 15, 2007
Sold by
New Charlie Tseng Corporation
Bought by
548 Management Corporation
Purchase Details
Closed on
Sep 4, 2003
Sold by
Black Andrew J
Bought by
The New Charlie Tseng Corperation
Create a Home Valuation Report for This Property
The Home Valuation Report is an in-depth analysis detailing your home's value as well as a comparison with similar homes in the area
Home Values in the Area
Average Home Value in this Area
Purchase History
| Date | Buyer | Sale Price | Title Company |
|---|---|---|---|
| United Assets Llc | $2,300,000 | -- | |
| 548 Management Corporation | -- | -- | |
| The New Charlie Tseng Corperation | $1,740,000 | -- |
Source: Public Records
Tax History
| Year | Tax Paid | Tax Assessment Tax Assessment Total Assessment is a certain percentage of the fair market value that is determined by local assessors to be the total taxable value of land and additions on the property. | Land | Improvement |
|---|---|---|---|---|
| 2025 | $124,451 | $1,258,740 | $515,610 | $743,130 |
| 2024 | $124,451 | $1,174,950 | $432,270 | $742,680 |
| 2023 | $116,129 | $1,096,380 | $348,930 | $747,450 |
| 2022 | $108,991 | $1,355,400 | $598,950 | $756,450 |
| 2021 | $82,579 | $772,200 | $182,250 | $589,950 |
| 2020 | $92,085 | $1,002,600 | $182,250 | $820,350 |
| 2019 | $85,521 | $985,050 | $182,250 | $802,800 |
| 2018 | $79,720 | $758,230 | $182,250 | $575,980 |
| 2017 | $74,343 | $707,090 | $182,250 | $524,840 |
| 2016 | $71,960 | $707,090 | $182,250 | $524,840 |
| 2015 | $23,431 | $628,560 | $182,250 | $446,310 |
| 2014 | $23,431 | $556,200 | $182,250 | $373,950 |
Source: Public Records
Map
Nearby Homes
- 14411 75th Ave
- 7504 147th St
- 144-41 76th Ave
- 73-41 141st Place
- 141-67 72nd Crescent
- 138-12 76th Ave
- 144-11 77th Rd Unit A
- 77-04 141st St Unit 67F
- 77-28 Vleigh Place Unit 81 B
- 138-28 77th Ave Unit 64C
- 72-08 150th St Unit 199A
- 72-08 150th St Unit 199B
- 141-25 78th Ave Unit 3-B
- 138-10 77th Ave Unit 60E
- 150-11 72 Rd Unit 4D
- 150-11 72 Rd Unit 3G
- 150-11 72nd Rd Unit 1C
- 150-11 72nd Rd Unit 4H
- 150-11 72nd Rd Unit H4
- 150-11 72 Rd Unit 6
Your Personal Tour Guide
Ask me questions while you tour the home.