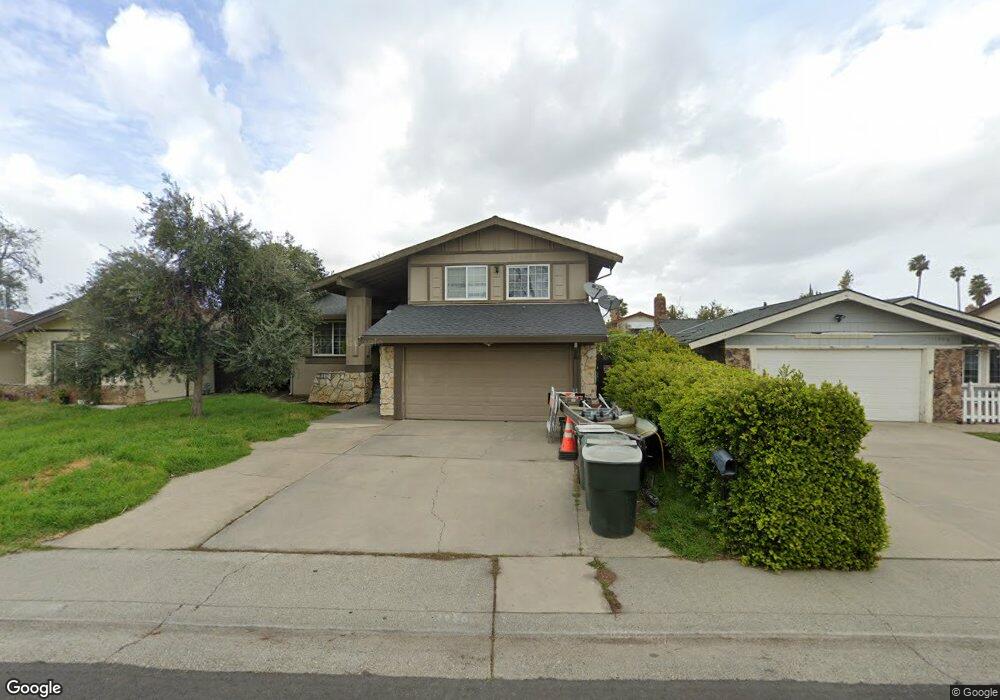
7513 Mctavish Cir Sacramento, CA 95828
Estimated Value: $204,000 - $503,000
4
Beds
3
Baths
1,829
Sq Ft
$228/Sq Ft
Est. Value
About This Home
This home is located at 7513 Mctavish Cir, Sacramento, CA 95828 and is currently estimated at $417,800, approximately $228 per square foot. 7513 Mctavish Cir is a home located in Sacramento County with nearby schools including David Reese Elementary School, James Rutter Middle School, and Florin High School.
Ownership History
Date
Name
Owned For
Owner Type
Purchase Details
Closed on
May 5, 2008
Sold by
Wells Fargo Bank Na
Bought by
Vong Sau
Current Estimated Value
Home Financials for this Owner
Home Financials are based on the most recent Mortgage that was taken out on this home.
Original Mortgage
$114,800
Outstanding Balance
$72,397
Interest Rate
5.8%
Mortgage Type
Purchase Money Mortgage
Estimated Equity
$345,403
Purchase Details
Closed on
Jul 27, 2007
Sold by
Thao Pao and Lee Susan
Bought by
Wells Fargo Bank Na and Imh Assets Corp Collateralized Asset Bac
Purchase Details
Closed on
Jul 11, 2005
Sold by
Storey Ernest L and Storey Yvonne M
Bought by
Thao Pao and Lee Susan
Home Financials for this Owner
Home Financials are based on the most recent Mortgage that was taken out on this home.
Original Mortgage
$262,500
Interest Rate
6.12%
Mortgage Type
Purchase Money Mortgage
Create a Home Valuation Report for This Property
The Home Valuation Report is an in-depth analysis detailing your home's value as well as a comparison with similar homes in the area
Home Values in the Area
Average Home Value in this Area
Purchase History
| Date | Buyer | Sale Price | Title Company |
|---|---|---|---|
| Vong Sau | $164,000 | Cornerstone Title Company | |
| Vong Sau | -- | Cornerstone Title Company | |
| Wells Fargo Bank Na | $246,500 | First American Title Co | |
| Thao Pao | $375,000 | First American Title Co |
Source: Public Records
Mortgage History
| Date | Status | Borrower | Loan Amount |
|---|---|---|---|
| Open | Vong Sau | $114,800 | |
| Previous Owner | Thao Pao | $262,500 |
Source: Public Records
Tax History Compared to Growth
Tax History
| Year | Tax Paid | Tax Assessment Tax Assessment Total Assessment is a certain percentage of the fair market value that is determined by local assessors to be the total taxable value of land and additions on the property. | Land | Improvement |
|---|---|---|---|---|
| 2025 | $2,325 | $215,403 | $137,913 | $77,490 |
| 2024 | $2,325 | $211,180 | $135,209 | $75,971 |
| 2023 | $2,267 | $207,040 | $132,558 | $74,482 |
| 2022 | $2,228 | $202,981 | $129,959 | $73,022 |
| 2021 | $2,203 | $199,002 | $127,411 | $71,591 |
| 2020 | $2,174 | $196,962 | $126,105 | $70,857 |
| 2019 | $2,134 | $193,101 | $123,633 | $69,468 |
| 2018 | $2,076 | $189,315 | $121,209 | $68,106 |
| 2017 | $2,040 | $185,604 | $118,833 | $66,771 |
| 2016 | $1,936 | $181,965 | $116,503 | $65,462 |
| 2015 | $1,899 | $179,233 | $114,754 | $64,479 |
| 2014 | $1,868 | $175,723 | $112,507 | $63,216 |
Source: Public Records
Map
Nearby Homes
- 7633 Clement Cir
- 7605 Mctavish Cir
- 7600 Clement Cir
- 7551 Red Bud Ln
- 7625 Par Pkwy
- 7548 Huckleberry Ln
- 7451 Albezzia Ln
- 7413 Skander Way
- 7206 Willowwest Ct
- 7313 Sunshire Ln
- 7309 Sunleaf Ln
- 7407 Sunborough Ln
- 7313 Sunsilver Ln
- 7467 Power Inn Rd
- 7566 Sunmore Ln
- 7716 La Reina Way
- 7618 Sunvaught Ln
- 7100 Sunbridge Ln
- 7724 La Bandera Way
- 8013 Skywoods Way
- 7517 Mctavish Cir
- 7509 Mctavish Cir
- 7521 Mctavish Cir
- 7505 Mctavish Cir
- 7645 Clement Cir
- 7641 Clement Cir
- 7649 Clement Cir
- 7637 Clement Cir
- 7512 Mctavish Cir
- 7508 Mctavish Cir
- 7653 Clement Cir
- 7525 Mctavish Cir
- 7501 Mctavish Cir
- 7516 Mctavish Cir
- 7504 Mctavish Cir
- 7520 Mctavish Cir
- 7657 Clement Cir
- 7529 Mctavish Cir
- 7500 Mctavish Cir
- 7524 Mctavish Cir