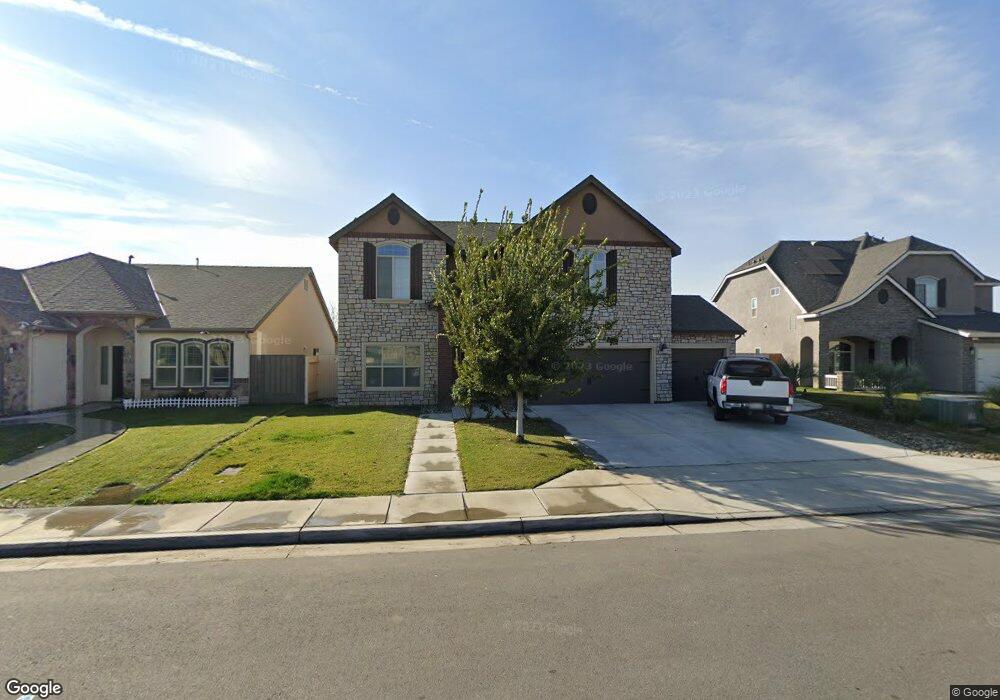
7513 Torrent Way Bakersfield, CA 93313
Panama NeighborhoodEstimated Value: $480,397 - $521,000
4
Beds
3
Baths
1,507
Sq Ft
$327/Sq Ft
Est. Value
About This Home
This home is located at 7513 Torrent Way, Bakersfield, CA 93313 and is currently estimated at $493,349, approximately $327 per square foot. 7513 Torrent Way is a home with nearby schools including Douglas J. Miller Elementary School, Stonecreek Junior High School, and Ridgeview High School.
Ownership History
Date
Name
Owned For
Owner Type
Purchase Details
Closed on
Mar 5, 2021
Sold by
Gill Rajandeep Kaur and Gill Drajandeep Kaur
Bought by
Gill Jagmohan Singh
Current Estimated Value
Home Financials for this Owner
Home Financials are based on the most recent Mortgage that was taken out on this home.
Original Mortgage
$170,000
Outstanding Balance
$126,007
Interest Rate
2.7%
Mortgage Type
New Conventional
Estimated Equity
$367,342
Purchase Details
Closed on
Mar 6, 2019
Sold by
Kaur Gill Rajandeep
Bought by
Kaur Gill Drajandeep and Singh Gill Jagmohan
Purchase Details
Closed on
Jan 28, 2019
Sold by
Sidhu Amandeep Singh
Bought by
Gill Rajandeep Kaur
Purchase Details
Closed on
Oct 1, 2018
Sold by
Lennar Homes Of California Inc
Bought by
Gill Rajandeep Kaur
Home Financials for this Owner
Home Financials are based on the most recent Mortgage that was taken out on this home.
Original Mortgage
$322,200
Interest Rate
4.6%
Mortgage Type
New Conventional
Create a Home Valuation Report for This Property
The Home Valuation Report is an in-depth analysis detailing your home's value as well as a comparison with similar homes in the area
Home Values in the Area
Average Home Value in this Area
Purchase History
| Date | Buyer | Sale Price | Title Company |
|---|---|---|---|
| Gill Jagmohan Singh | $170,000 | Western Resources Title | |
| Kaur Gill Drajandeep | -- | None Available | |
| Gill Rajandeep Kaur | -- | North American Title Co | |
| Gill Rajandeep Kaur | $339,500 | North American Title Co |
Source: Public Records
Mortgage History
| Date | Status | Borrower | Loan Amount |
|---|---|---|---|
| Open | Gill Jagmohan Singh | $170,000 | |
| Previous Owner | Gill Rajandeep Kaur | $322,200 |
Source: Public Records
Tax History Compared to Growth
Tax History
| Year | Tax Paid | Tax Assessment Tax Assessment Total Assessment is a certain percentage of the fair market value that is determined by local assessors to be the total taxable value of land and additions on the property. | Land | Improvement |
|---|---|---|---|---|
| 2025 | $5,305 | $392,574 | $65,937 | $326,637 |
| 2024 | $5,216 | $384,877 | $64,644 | $320,233 |
| 2023 | $5,216 | $377,331 | $63,377 | $313,954 |
| 2022 | $5,006 | $369,934 | $62,135 | $307,799 |
| 2021 | $4,795 | $349,362 | $61,834 | $287,528 |
| 2020 | $4,734 | $345,780 | $61,200 | $284,580 |
| 2019 | $4,206 | $305,427 | $50,738 | $254,689 |
| 2018 | $3,460 | $293,569 | $48,769 | $244,800 |
| 2017 | $3,551 | $287,813 | $47,813 | $240,000 |
Source: Public Records
Map
Nearby Homes
- 7521 Torrent Way
- 5903 Cardano Ave
- 5910 Pareto Place
- 5406 Ripple Cove Way
- 6009 Cardano Ave
- 5408 Transparent Ct
- 7327 Glitter Way
- 5913 Blue Spruce Ave
- 6105 Borelli Ave
- 6109 Pareto Place
- 5803 Vespucci Ave
- 7716 Prism Way
- 6414 Marconi Ave
- 6006 Vespucci Ave
- 5101 Shining Crag Ave
- 6003 Vespucci Ave
- 5017 Clear Crystal Dr
- 6104 Vespucci Ave
- 6222 Marconi Ave
- 6229 Marconi Ave
- 7517 Torrent Way
- 7509 Torrent Way
- 5527 Clarion Channel Ln
- 7503 Torrent Way
- 7516 Torrent Way
- 5532 Clarion Channel Ln
- 7522 Torrent Way
- 5521 Clarion Channel Ln
- 5528 Clarion Channel Ln
- 7600 Torrent Way
- 7607 Torrent Way
- 5517 Clarion Channel Ln
- 5524 Clarion Channel Ln
- 5520 Rivulet Run Ct
- 5525 Rivulet Run Ct
- 7610 Torrent Way
- 5520 Clarion Channel Ln
- 5613 Crystal Cascade Ln
- 5609 Crystal Cascade Ln
- 5513 Clarion Channel Ln