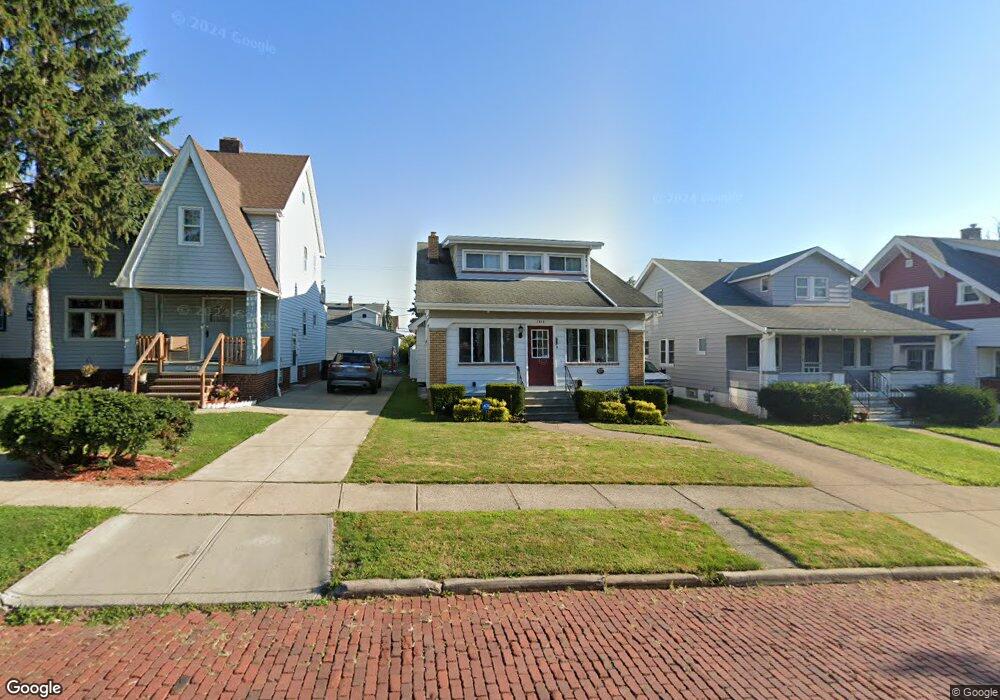
7514 Newport Ave Cleveland, OH 44129
Estimated Value: $197,000 - $243,000
5
Beds
2
Baths
2,027
Sq Ft
$108/Sq Ft
Est. Value
About This Home
This home is located at 7514 Newport Ave, Cleveland, OH 44129 and is currently estimated at $219,062, approximately $108 per square foot. 7514 Newport Ave is a home located in Cuyahoga County with nearby schools including Ridge-Brook Elementary School, Greenbriar Middle School, and Parma High School.
Ownership History
Date
Name
Owned For
Owner Type
Purchase Details
Closed on
May 20, 2011
Sold by
Pastrana Clare C
Bought by
Pastrana Clare C and Graves Robert G
Current Estimated Value
Purchase Details
Closed on
Nov 23, 2009
Sold by
Middendorf Michael D and Middendorf Mary F
Bought by
Pastrana Clare C
Home Financials for this Owner
Home Financials are based on the most recent Mortgage that was taken out on this home.
Original Mortgage
$81,496
Outstanding Balance
$53,077
Interest Rate
4.95%
Mortgage Type
FHA
Estimated Equity
$165,985
Purchase Details
Closed on
Jun 20, 2005
Sold by
Daley Patricia G and Daley Grace M
Bought by
Middendorf Michael D
Home Financials for this Owner
Home Financials are based on the most recent Mortgage that was taken out on this home.
Original Mortgage
$124,000
Interest Rate
5.82%
Mortgage Type
Fannie Mae Freddie Mac
Purchase Details
Closed on
Jan 1, 1975
Bought by
Daley Patricia G
Create a Home Valuation Report for This Property
The Home Valuation Report is an in-depth analysis detailing your home's value as well as a comparison with similar homes in the area
Home Values in the Area
Average Home Value in this Area
Purchase History
| Date | Buyer | Sale Price | Title Company |
|---|---|---|---|
| Pastrana Clare C | -- | Maximum Title | |
| Pastrana Clare C | $83,000 | Attorney | |
| Middendorf Michael D | $125,000 | Cleveland Home | |
| Daley Patricia G | -- | -- |
Source: Public Records
Mortgage History
| Date | Status | Borrower | Loan Amount |
|---|---|---|---|
| Open | Pastrana Clare C | $81,496 | |
| Previous Owner | Middendorf Michael D | $124,000 |
Source: Public Records
Tax History Compared to Growth
Tax History
| Year | Tax Paid | Tax Assessment Tax Assessment Total Assessment is a certain percentage of the fair market value that is determined by local assessors to be the total taxable value of land and additions on the property. | Land | Improvement |
|---|---|---|---|---|
| 2024 | $3,609 | $59,535 | $9,940 | $49,595 |
| 2023 | $2,843 | $39,690 | $8,190 | $31,500 |
| 2022 | $2,816 | $39,690 | $8,190 | $31,500 |
| 2021 | $2,895 | $39,690 | $8,190 | $31,500 |
| 2020 | $2,537 | $30,520 | $6,300 | $24,220 |
| 2019 | $2,426 | $87,200 | $18,000 | $69,200 |
| 2018 | $2,439 | $30,520 | $6,300 | $24,220 |
| 2017 | $2,126 | $24,500 | $4,410 | $20,090 |
| 2016 | $2,113 | $24,500 | $4,410 | $20,090 |
| 2015 | $2,080 | $24,500 | $4,410 | $20,090 |
| 2014 | $2,080 | $26,080 | $4,690 | $21,390 |
Source: Public Records
Map
Nearby Homes
- 7707 Liberty Ave
- 8206 Newport Ave
- 6606 Theota Ave
- 6211 Luelda Ave
- 6014 Laverne Ave
- 5906 Velma Ave
- 8018 Pinegrove Ave
- 5810 Laverne Ave
- 6508 Delora Ave
- 6011 Theota Ave
- 6306 Flowerdale Ave
- 8119 Pinegrove Ave
- 5618 Bradley Ave
- 5511 Velma Ave
- 7609 Wooster Pkwy
- 6025 Northcliff Ave
- 6209 Archmere Ave
- 5901 Delora Ave
- 5406 Merkle Ave
- 5637 Flowerdale Ave
- 7510 Newport Ave
- 7518 Newport Ave
- 7506 Newport Ave
- 7542 Newport Ave
- 7502 Newport Ave
- 7515 Liberty Ave
- 7602 Newport Ave
- 7511 Liberty Ave
- 7519 Liberty Ave
- 7507 Liberty Ave
- 7523 Liberty Ave
- 7418 Newport Ave
- 7606 Newport Ave
- 7603 Liberty Ave
- 7503 Liberty Ave
- 7515 Newport Ave
- 7519 Newport Ave
- 7511 Newport Ave
- 7507 Newport Ave
- 7543 Newport Ave