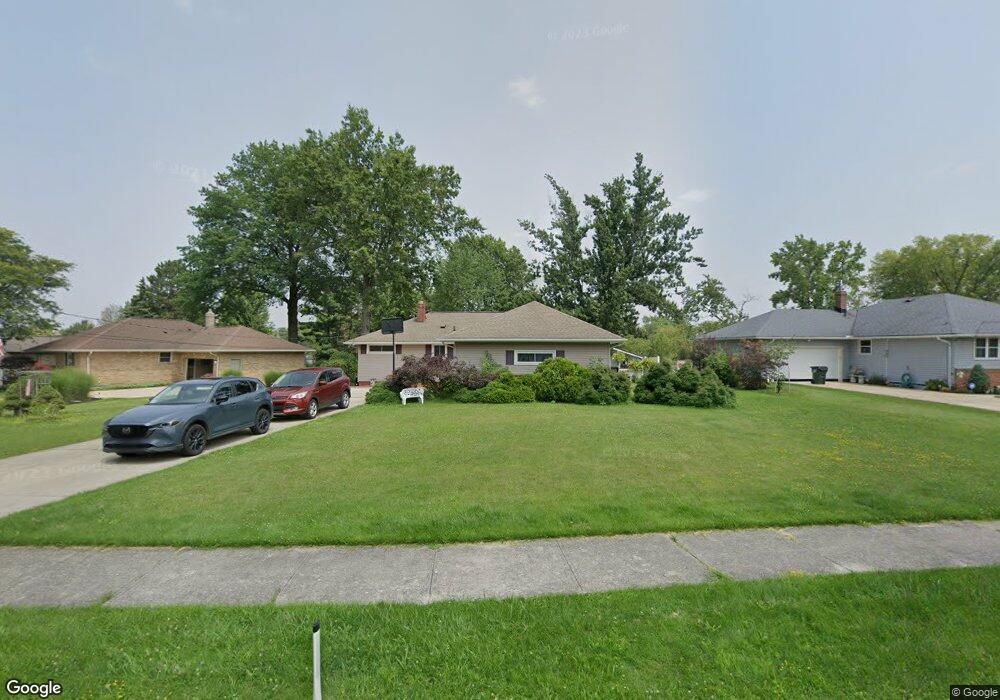
7515 Bradenton Blvd Cleveland, OH 44134
Estimated Value: $242,000 - $299,000
3
Beds
2
Baths
1,337
Sq Ft
$194/Sq Ft
Est. Value
About This Home
This home is located at 7515 Bradenton Blvd, Cleveland, OH 44134 and is currently estimated at $259,301, approximately $193 per square foot. 7515 Bradenton Blvd is a home located in Cuyahoga County with nearby schools including Green Valley Elementary School, Normandy High School, and Hillside Middle School.
Ownership History
Date
Name
Owned For
Owner Type
Purchase Details
Closed on
Jan 3, 2001
Sold by
Geiger Joseph A
Bought by
Nageotte Scott P and Nageotte Dawn M
Current Estimated Value
Home Financials for this Owner
Home Financials are based on the most recent Mortgage that was taken out on this home.
Original Mortgage
$115,600
Outstanding Balance
$43,116
Interest Rate
7.69%
Estimated Equity
$216,185
Purchase Details
Closed on
May 31, 1991
Sold by
Minor Shirley M 1 and Minor 5
Bought by
Geiger Joseph Ajr
Purchase Details
Closed on
Jan 24, 1991
Sold by
Geiger Joseph A
Bought by
Minor Shirley M 1 and Minor 5
Purchase Details
Closed on
May 19, 1986
Sold by
Geiger Joseph A and Geiger Alice E
Bought by
Geiger Joseph A
Purchase Details
Closed on
Mar 29, 1985
Sold by
Geiger Joseph A and Geiger Alice E
Bought by
Geiger Joseph A and Geiger Alice E
Purchase Details
Closed on
Jan 1, 1975
Bought by
Geiger Joseph A and Geiger Alice E
Create a Home Valuation Report for This Property
The Home Valuation Report is an in-depth analysis detailing your home's value as well as a comparison with similar homes in the area
Home Values in the Area
Average Home Value in this Area
Purchase History
| Date | Buyer | Sale Price | Title Company |
|---|---|---|---|
| Nageotte Scott P | $128,500 | Reliance Title | |
| Geiger Joseph Ajr | $34,400 | -- | |
| Minor Shirley M 1 | -- | -- | |
| Geiger Joseph A | -- | -- | |
| Geiger Joseph A | -- | -- | |
| Geiger Joseph A | -- | -- |
Source: Public Records
Mortgage History
| Date | Status | Borrower | Loan Amount |
|---|---|---|---|
| Open | Nageotte Scott P | $115,600 |
Source: Public Records
Tax History Compared to Growth
Tax History
| Year | Tax Paid | Tax Assessment Tax Assessment Total Assessment is a certain percentage of the fair market value that is determined by local assessors to be the total taxable value of land and additions on the property. | Land | Improvement |
|---|---|---|---|---|
| 2024 | $4,883 | $74,445 | $18,690 | $55,755 |
| 2023 | $4,478 | $58,210 | $13,230 | $44,980 |
| 2022 | $4,284 | $57,090 | $13,230 | $43,860 |
| 2021 | $4,400 | $57,090 | $13,230 | $43,860 |
| 2020 | $4,188 | $47,990 | $11,130 | $36,860 |
| 2019 | $4,038 | $137,100 | $31,800 | $105,300 |
| 2018 | $3,754 | $47,990 | $11,130 | $36,860 |
| 2017 | $3,941 | $43,370 | $9,490 | $33,880 |
| 2016 | $3,918 | $43,370 | $9,490 | $33,880 |
| 2015 | $3,536 | $43,370 | $9,490 | $33,880 |
| 2014 | $3,536 | $44,700 | $9,770 | $34,930 |
Source: Public Records
Map
Nearby Homes
- 7558 Pleasant View Dr
- 4402 Stary Dr
- 2800 Bonny Blvd
- 3350 Saint Andrews Dr
- 2830 Brian Dr
- 7531 Vista Dr
- 4803 Sassafras Dr
- 4440 Coral Gables Dr
- 7744 Cecelia Dr
- 7791 Hoertz Rd
- 2644 Nottingham Dr
- 7180 Marko Ln
- 3200 Dentzler Rd
- 2330 Judy Dr
- 3610 Jeanne Dr
- 1881 W Pleasant Valley Rd
- 8053 Thornhurst Dr
- 3195 Marda Dr
- 4591 W Sprague Rd
- 7030 Lyle Ave
- 7505 Bradenton Blvd
- 7533 Bradenton Blvd
- 7495 Bradenton Blvd
- 7537 Bradenton Blvd
- 3246 Sunhaven Oval
- 7485 Bradenton Blvd
- 7541 Bradenton Blvd
- 7520 Bradenton Blvd
- 7512 Bradenton Blvd
- 3280 Sunhaven Oval
- 7530 Bradenton Blvd
- 7500 Bradenton Blvd
- 3240 Sunhaven Oval
- 7490 Bradenton Blvd
- 3296 Sunhaven Oval
- 7475 Bradenton Blvd
- 7484 Bradenton Blvd
- 3236 Sunhaven Oval
- 3306 Sunhaven Oval
- 7459 Bradenton Blvd