7515 W 110th St Bloomington, MN 55438
West Bloomington NeighborhoodEstimated Value: $155,000 - $199,000
1
Bed
1
Bath
768
Sq Ft
$227/Sq Ft
Est. Value
About This Home
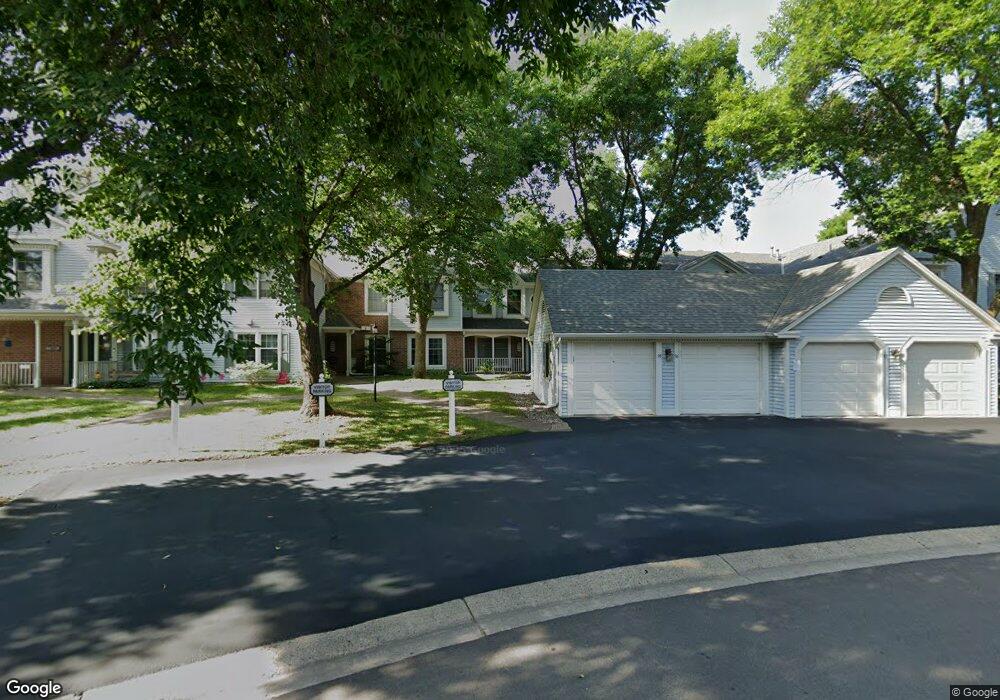
This home is located at 7515 W 110th St, Bloomington, MN 55438 and is currently estimated at $174,715, approximately $227 per square foot. 7515 W 110th St is a home located in Hennepin County with nearby schools including Olson Elementary School, Olson Middle School, and Jefferson Senior High School.
Ownership History
Date
Name
Owned For
Owner Type
Purchase Details
Closed on
May 6, 2025
Sold by
Gregerson Kevin Scott and Gregerson Gloria Desjardin
Bought by
Gloria D Gregerson Revocable Trust and Gregerson
Current Estimated Value
Purchase Details
Closed on
Sep 28, 2018
Sold by
Gregerson Gloria Desjardine and Gregerson Kevin Scott
Bought by
Gregerson Gloria Desjardine and Gregerson Kevin Scott
Purchase Details
Closed on
Oct 19, 2015
Sold by
Tasi Andrew Philip
Bought by
Desjardine Gloria Lynn
Purchase Details
Closed on
Jul 14, 2015
Sold by
Puffer Katherine A
Bought by
Desjardine Gloria
Home Financials for this Owner
Home Financials are based on the most recent Mortgage that was taken out on this home.
Original Mortgage
$103,360
Interest Rate
4.03%
Mortgage Type
New Conventional
Purchase Details
Closed on
Nov 13, 2014
Sold by
Vonholtum Elizabeth J
Bought by
Elizabeth J Von Holtum Irrevocable Trust
Create a Home Valuation Report for This Property
The Home Valuation Report is an in-depth analysis detailing your home's value as well as a comparison with similar homes in the area
Home Values in the Area
Average Home Value in this Area
Purchase History
| Date | Buyer | Sale Price | Title Company |
|---|---|---|---|
| Gloria D Gregerson Revocable Trust | $500 | None Listed On Document | |
| Gregerson Gloria Desjardine | -- | None Available | |
| Desjardine Gloria Lynn | -- | None Available | |
| Desjardine Gloria | $108,800 | Burnet Title | |
| Elizabeth J Von Holtum Irrevocable Trust | $105,000 | None Available |
Source: Public Records
Mortgage History
| Date | Status | Borrower | Loan Amount |
|---|---|---|---|
| Previous Owner | Desjardine Gloria | $103,360 |
Source: Public Records
Tax History
| Year | Tax Paid | Tax Assessment Tax Assessment Total Assessment is a certain percentage of the fair market value that is determined by local assessors to be the total taxable value of land and additions on the property. | Land | Improvement |
|---|---|---|---|---|
| 2024 | $1,817 | $167,200 | $53,700 | $113,500 |
| 2023 | $1,776 | $166,500 | $53,700 | $112,800 |
| 2022 | $1,582 | $158,500 | $53,700 | $104,800 |
| 2021 | $1,542 | $144,500 | $50,200 | $94,300 |
| 2020 | $1,479 | $142,400 | $48,700 | $93,700 |
| 2019 | $1,373 | $134,700 | $50,000 | $84,700 |
| 2018 | $1,034 | $125,300 | $50,400 | $74,900 |
| 2017 | $994 | $97,700 | $41,900 | $55,800 |
| 2016 | $860 | $85,800 | $38,800 | $47,000 |
| 2015 | $654 | $67,100 | $37,300 | $29,800 |
| 2014 | -- | $74,600 | $36,200 | $38,400 |
Source: Public Records
Map
Nearby Homes
- 7525 W 110th St Unit 7
- 7526 W 111th St
- 7555 W 110th St
- 10905 Rhode Island Ave S
- 11159 Sumter Ave S
- 10935 Oregon Ave S
- 7404 Landau Dr
- 7229 Woodstock Curve Unit 6
- 7334 W 114th Street Cir
- 11380 Louisiana Cir
- 7041 Kenmare Dr
- 6958 Kenmare Dr
- 10512 Decatur Ave S
- 7601 W 101st St Unit 216
- 7401 W 101st St Unit 111
- 7501 W 100th St
- 10127 Trotters Path
- 6100 Auto Club Rd Unit 211
- 10316 Nesbitt Ave S
- 10425 Vessey Rd
- 7529 W 110th St
- 7509 W 110th St
- 7501 W 110th St
- 7501 W 110th St Unit 1
- 7517 W 110th St Unit 5
- 7523 W 110th St
- 7511 W 110th St
- 7507 W 110th St
- 7503 W 110th St
- 7517 W 110th St
- 7513 W 110th St
- 7505 W 110th St
- 7521 W 110th St Unit 6
- 7527 W 110th St
- 7531 W 110th St Unit 16
- 7620 W 111th St
- 7538 7538 111th-Street-w
- 7538 W 111th St
- 7624 W 111th St
- 7536 W 111th St
Your Personal Tour Guide
Ask me questions while you tour the home.