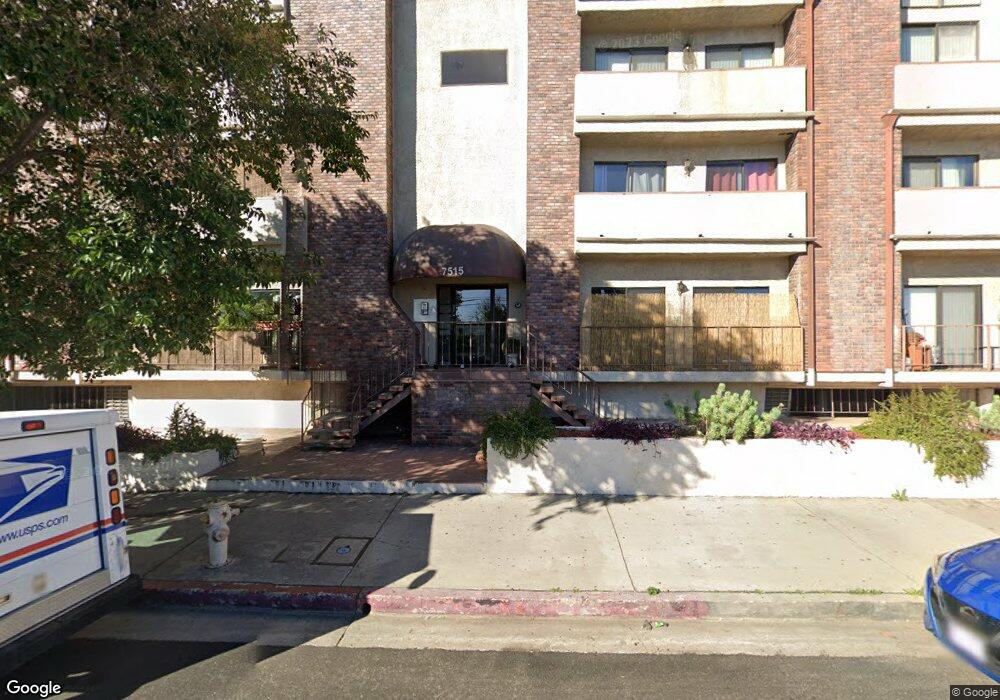
7515 Winnetka Ave Unit 301 Winnetka, CA 91306
Estimated Value: $485,000 - $692,000
2
Beds
3
Baths
2,021
Sq Ft
$304/Sq Ft
Est. Value
About This Home
This home is located at 7515 Winnetka Ave Unit 301, Winnetka, CA 91306 and is currently estimated at $614,907, approximately $304 per square foot. 7515 Winnetka Ave Unit 301 is a home located in Los Angeles County with nearby schools including Stanley Mosk Elementary School, John A. Sutter Middle School, and Northridge Academy High.
Ownership History
Date
Name
Owned For
Owner Type
Purchase Details
Closed on
Jul 17, 1998
Sold by
Roco Francisco Aranda and Roco Maureen Llorente
Bought by
Roco Francisco and Llorente Roco Maureen
Current Estimated Value
Home Financials for this Owner
Home Financials are based on the most recent Mortgage that was taken out on this home.
Original Mortgage
$72,000
Outstanding Balance
$14,734
Interest Rate
7%
Estimated Equity
$600,173
Purchase Details
Closed on
Apr 22, 1997
Sold by
State Street Bank Na
Bought by
Roco Francisco Aranda and Roco Maureen Llorente
Home Financials for this Owner
Home Financials are based on the most recent Mortgage that was taken out on this home.
Original Mortgage
$60,800
Interest Rate
7.86%
Purchase Details
Closed on
Aug 29, 1995
Sold by
Kram Steven D and State Street Bank Na
Bought by
State Street Bank Na
Create a Home Valuation Report for This Property
The Home Valuation Report is an in-depth analysis detailing your home's value as well as a comparison with similar homes in the area
Home Values in the Area
Average Home Value in this Area
Purchase History
| Date | Buyer | Sale Price | Title Company |
|---|---|---|---|
| Roco Francisco | -- | United Title Company | |
| Roco Francisco Aranda | $64,000 | Stewart Title | |
| State Street Bank Na | $65,000 | First Southwestern Title |
Source: Public Records
Mortgage History
| Date | Status | Borrower | Loan Amount |
|---|---|---|---|
| Open | Roco Francisco | $72,000 | |
| Closed | Roco Francisco Aranda | $60,800 |
Source: Public Records
Tax History Compared to Growth
Tax History
| Year | Tax Paid | Tax Assessment Tax Assessment Total Assessment is a certain percentage of the fair market value that is determined by local assessors to be the total taxable value of land and additions on the property. | Land | Improvement |
|---|---|---|---|---|
| 2025 | $1,364 | $104,204 | $26,040 | $78,164 |
| 2024 | $1,364 | $102,162 | $25,530 | $76,632 |
| 2023 | $1,339 | $100,160 | $25,030 | $75,130 |
| 2022 | $1,279 | $98,197 | $24,540 | $73,657 |
| 2021 | $1,249 | $96,272 | $24,059 | $72,213 |
| 2019 | $1,211 | $93,419 | $23,347 | $70,072 |
| 2018 | $1,193 | $91,589 | $22,890 | $68,699 |
| 2016 | $1,113 | $88,034 | $22,002 | $66,032 |
| 2015 | $1,097 | $86,713 | $21,672 | $65,041 |
| 2014 | $1,107 | $85,015 | $21,248 | $63,767 |
Source: Public Records
Map
Nearby Homes
- 20110 Cohasset St
- 20122 Cohasset St
- 20214 Cohasset St
- 20158 Cohasset St Unit 10
- 20155 Keswick St Unit 209
- 20134 Leadwell St Unit 306
- 20134 Leadwell St Unit 156
- 20134 Leadwell St Unit 217
- 20134 Leadwell St Unit 133
- 7400 Lubao Ave
- 20235 Keswick St Unit 102
- 7640 Oso Ave Unit 316
- 7640 Oso Ave Unit 217
- 20253 Keswick St Unit 326
- 20253 Keswick St Unit 105
- 20254 Stagg St
- 7539 Hatillo Ave
- 7800 Winnetka Ave
- 19803 Covello St
- 20329 Stagg St
- 7515 Winnetka Ave
- 7515 Winnetka Ave
- 7515 Winnetka Ave Unit 1010
- 7515 Winnetka Ave Unit 308
- 7515 Winnetka Ave Unit 109
- 7515 Winnetka Ave Unit 102
- 7515 Winnetka Ave Unit 106
- 7515 Winnetka Ave Unit 302
- 7515 Winnetka Ave Unit 101
- 7515 Winnetka Ave Unit 103
- 7515 Winnetka Ave Unit 107
- 7515 Winnetka Ave Unit 105
- 7515 Winnetka Ave Unit 112
- 7515 Winnetka Ave Unit 305
- 7515 Winnetka Ave Unit 303
- 7515 Winnetka Ave Unit 108
- 7515 Winnetka Ave Unit 307
- 7515 Winnetka Ave Unit 306
- 7515 Winnetka Ave Unit 304
- 7515 Winnetka Ave Unit 116