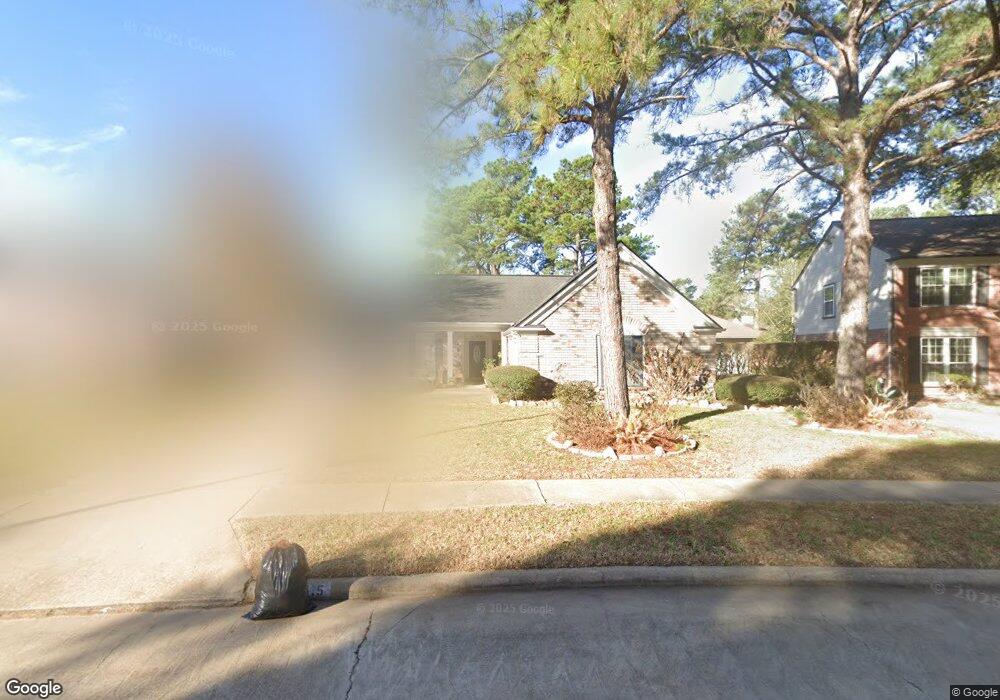
7515 Wisteria Ridge Ct Houston, TX 77095
Copperfield NeighborhoodEstimated Value: $294,018 - $319,000
4
Beds
2
Baths
1,977
Sq Ft
$157/Sq Ft
Est. Value
About This Home
This home is located at 7515 Wisteria Ridge Ct, Houston, TX 77095 and is currently estimated at $310,005, approximately $156 per square foot. 7515 Wisteria Ridge Ct is a home located in Harris County with nearby schools including Lowery Elementary School, Aragon Middle School, and Langham Creek High School.
Ownership History
Date
Name
Owned For
Owner Type
Purchase Details
Closed on
Dec 22, 2000
Sold by
Coon Jerry and Coon Gwendolyn
Bought by
Norris David P and Norris Loretta J
Current Estimated Value
Home Financials for this Owner
Home Financials are based on the most recent Mortgage that was taken out on this home.
Original Mortgage
$120,550
Outstanding Balance
$44,520
Interest Rate
7.73%
Estimated Equity
$265,485
Purchase Details
Closed on
Jul 16, 1999
Sold by
Staines Michael J and Staines Kim L
Bought by
Coon Jerry and Coon Gwendolyn
Home Financials for this Owner
Home Financials are based on the most recent Mortgage that was taken out on this home.
Original Mortgage
$87,120
Interest Rate
7.63%
Create a Home Valuation Report for This Property
The Home Valuation Report is an in-depth analysis detailing your home's value as well as a comparison with similar homes in the area
Home Values in the Area
Average Home Value in this Area
Purchase History
| Date | Buyer | Sale Price | Title Company |
|---|---|---|---|
| Norris David P | -- | Chicago Title | |
| Coon Jerry | -- | Alamo Title |
Source: Public Records
Mortgage History
| Date | Status | Borrower | Loan Amount |
|---|---|---|---|
| Open | Norris David P | $120,550 | |
| Previous Owner | Coon Jerry | $87,120 |
Source: Public Records
Tax History Compared to Growth
Tax History
| Year | Tax Paid | Tax Assessment Tax Assessment Total Assessment is a certain percentage of the fair market value that is determined by local assessors to be the total taxable value of land and additions on the property. | Land | Improvement |
|---|---|---|---|---|
| 2025 | $1,484 | $271,600 | $75,852 | $195,748 |
| 2024 | $1,484 | $280,712 | $65,958 | $214,754 |
| 2023 | $1,484 | $291,308 | $65,958 | $225,350 |
| 2022 | $5,612 | $263,789 | $46,995 | $216,794 |
| 2021 | $5,392 | $215,196 | $46,995 | $168,201 |
| 2020 | $5,057 | $193,217 | $39,163 | $154,054 |
| 2019 | $5,203 | $204,916 | $39,163 | $165,753 |
| 2018 | $1,656 | $175,000 | $39,163 | $135,837 |
| 2017 | $4,749 | $175,000 | $39,163 | $135,837 |
| 2016 | $4,749 | $175,000 | $39,163 | $135,837 |
| 2015 | $3,313 | $177,831 | $39,163 | $138,668 |
| 2014 | $3,313 | $157,524 | $34,216 | $123,308 |
Source: Public Records
Map
Nearby Homes
- 7607 Plumtree Forest Cir
- 7519 Sunlight Ln
- 16734 Pebbleglen Dr
- 16502 Rainbow Lake Rd
- 16911 Shady Square Ct
- 7719 Woodlett Ct
- 7307 Sunlight Ln
- 7311 Barton Oaks Dr
- 16346 Pebbleglen Dr
- 7306 Bubbling Brooks Ln
- 7254 Sonnet Glen Ln
- 17010 Poplar Hill St
- 7539 Wildwood Brook Ct
- 7215 Daylight Ln
- 7311 Postwick Ct
- 16331 Dew Drop Ln
- 7511 Marble Glen Ln
- 16902 Terrace Park Dr
- 7411 Marble Glen Ln
- 17222 Crown Meadow Ct
- 7511 Wisteria Ridge Ct
- 7519 Wisteria Ridge Ct
- 7510 Plumtree Forest Ct
- 7514 Plumtree Forest Ct
- 7506 Plumtree Forest Ct
- 7518 Plumtree Forest Ct
- 7505 Wisteria Ridge Ct
- 7514 Wisteria Ridge Ct
- 7510 Wisteria Ridge Ct
- 7603 Wisteria Ridge Ct
- 7503 Wisteria Ridge Ct
- 7502 Plumtree Forest Ct
- 7506 Wisteria Ridge Ct
- 7602 Plumtree Forest Cir
- 7502 Wisteria Ridge Ct
- 7519 Valley Laurel Ct
- 7515 Valley Laurel Ct
- 7607 Wisteria Ridge Ct
- 7503 Plumtree Forest Ct
- 7515 Plumtree Forest Ct