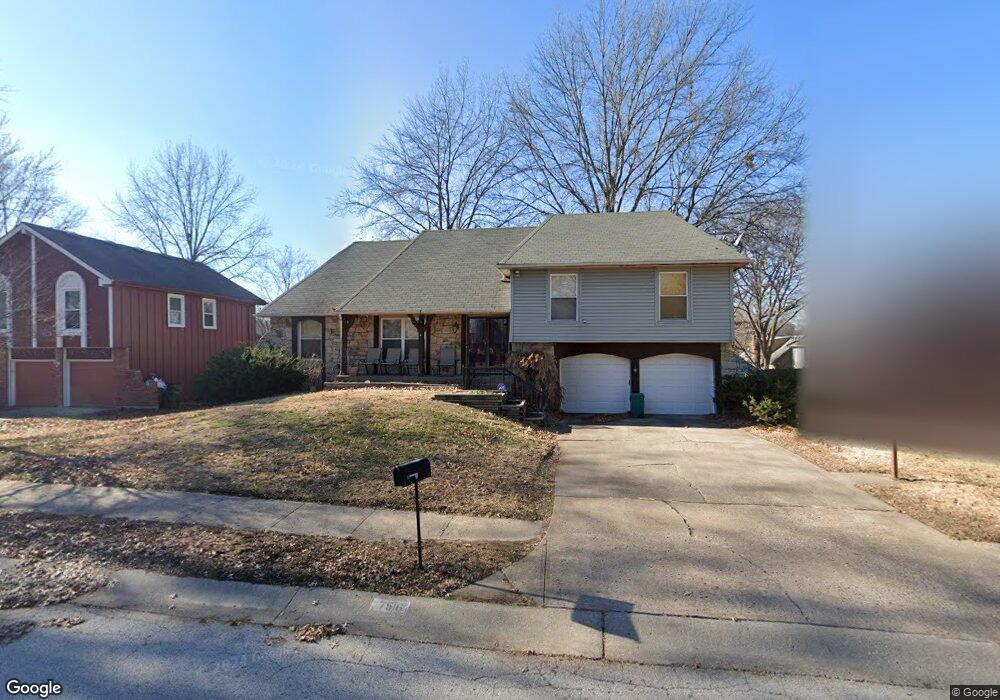
7516 Crisp Ave Raytown, MO 64138
Estimated Value: $251,000 - $280,000
3
Beds
2
Baths
1,804
Sq Ft
$147/Sq Ft
Est. Value
About This Home
This home is located at 7516 Crisp Ave, Raytown, MO 64138 and is currently estimated at $264,354, approximately $146 per square foot. 7516 Crisp Ave is a home located in Jackson County with nearby schools including Robinson Elementary School and Raytown Central Middle School.
Ownership History
Date
Name
Owned For
Owner Type
Purchase Details
Closed on
Feb 7, 2007
Sold by
Tyson Forest E and Tyson Evelyn G
Bought by
Webster Tyson Sharon
Current Estimated Value
Home Financials for this Owner
Home Financials are based on the most recent Mortgage that was taken out on this home.
Original Mortgage
$144,000
Outstanding Balance
$92,489
Interest Rate
7.5%
Mortgage Type
Purchase Money Mortgage
Estimated Equity
$171,865
Purchase Details
Closed on
Aug 30, 2005
Sold by
S & P Properties
Bought by
Tyson Forest E and Tyson Evelyn G
Home Financials for this Owner
Home Financials are based on the most recent Mortgage that was taken out on this home.
Original Mortgage
$123,000
Interest Rate
7.75%
Mortgage Type
Stand Alone First
Purchase Details
Closed on
May 20, 2005
Sold by
Webster Tyson Sharon K
Bought by
S & P Properties
Purchase Details
Closed on
Feb 19, 1997
Sold by
Soper Russell L and Soper Linda L
Bought by
Webster Tyson Sharon K
Home Financials for this Owner
Home Financials are based on the most recent Mortgage that was taken out on this home.
Original Mortgage
$95,501
Interest Rate
7.85%
Mortgage Type
FHA
Create a Home Valuation Report for This Property
The Home Valuation Report is an in-depth analysis detailing your home's value as well as a comparison with similar homes in the area
Home Values in the Area
Average Home Value in this Area
Purchase History
| Date | Buyer | Sale Price | Title Company |
|---|---|---|---|
| Webster Tyson Sharon | -- | Title Enterprises | |
| Tyson Forest E | -- | First American Title Ins Co | |
| S & P Properties | $109,146 | First American Title Ins Co | |
| Webster Tyson Sharon K | -- | Chicago Title Insurance Co |
Source: Public Records
Mortgage History
| Date | Status | Borrower | Loan Amount |
|---|---|---|---|
| Open | Webster Tyson Sharon | $144,000 | |
| Previous Owner | Tyson Forest E | $123,000 | |
| Previous Owner | Webster Tyson Sharon K | $95,501 |
Source: Public Records
Tax History
| Year | Tax Paid | Tax Assessment Tax Assessment Total Assessment is a certain percentage of the fair market value that is determined by local assessors to be the total taxable value of land and additions on the property. | Land | Improvement |
|---|---|---|---|---|
| 2025 | $4,384 | $37,941 | $4,809 | $33,132 |
| 2024 | $4,354 | $48,594 | $3,943 | $44,651 |
| 2023 | $4,354 | $48,594 | $5,698 | $42,896 |
| 2022 | $2,699 | $28,690 | $3,534 | $25,156 |
| 2021 | $2,708 | $28,690 | $3,534 | $25,156 |
| 2020 | $2,595 | $27,232 | $3,534 | $23,698 |
| 2019 | $2,581 | $27,232 | $3,534 | $23,698 |
| 2018 | $2,084 | $22,767 | $3,349 | $19,418 |
| 2017 | $2,084 | $22,767 | $3,349 | $19,418 |
| 2016 | $2,032 | $22,330 | $3,523 | $18,807 |
Source: Public Records
Map
Nearby Homes
- 7606 Woodson Rd
- 7427 & 7429 Englewood Ln
- 7423 & 7425 Englewood Ln
- 7402 Englewood Ln
- 7423 Harris Ave
- 11800 E 77th St
- 11605 E 78th St
- 11709 E 77th Terrace
- 11101 E 72nd Terrace
- 7539 Westridge Rd
- 7141 Sterling Ave
- 7317 Hedges Ave
- 7311 Hedges Ave
- 7824 Westridge Rd
- 7828 Westridge Rd
- 7923 Harris Ave
- 7650 Larson Ave
- 7421 Hardy Ave
- 12304 E 78th St
- 7325 Hardy Ave
- 7520 Crisp Ave
- 7512 Crisp Ave
- 11220 E 76th St
- 7600 Crisp Ave
- 11221 E 75th Terrace
- 7517 Crisp Ave
- 11214 E 76th St
- 11221 E 76th St
- 7513 Crisp Ave
- 7601 Crisp Ave
- 7604 Crisp Ave
- 7509 Crisp Ave
- 11224 E 75th Terrace
- 7516 Englewood Ave
- 7605 Crisp Ave
- 11208 E 76th St
- 7608 Crisp Ave
- 11220 E 75th Terrace
- 11215 E 76th St
- 7600 Englewood Ave
Your Personal Tour Guide
Ask me questions while you tour the home.