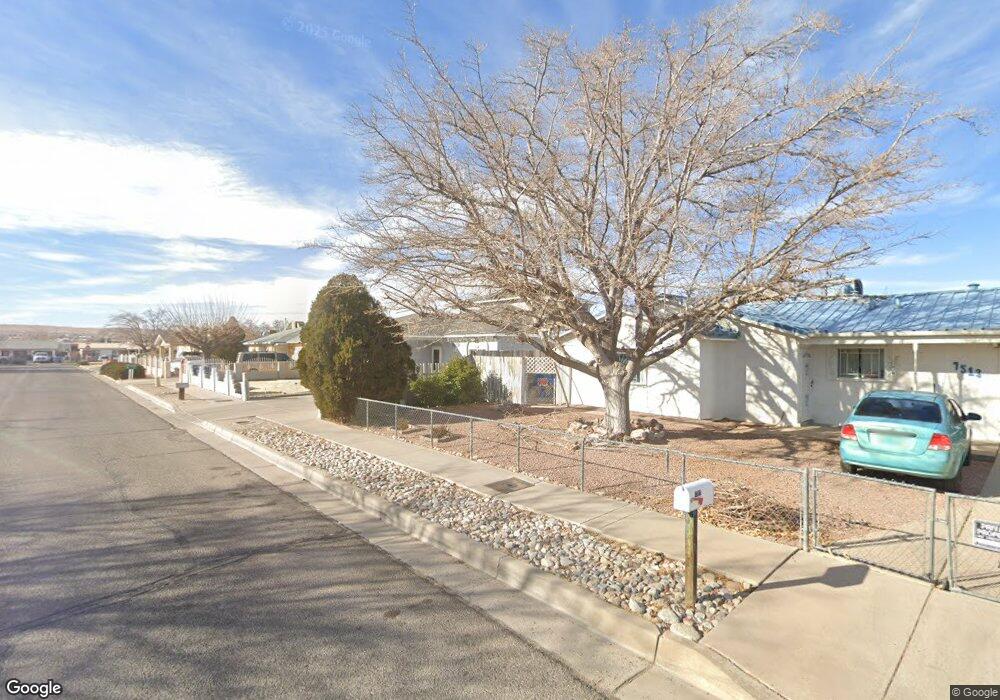
7517 Forsythe Rd SW Albuquerque, NM 87121
Southwest Heights NeighborhoodEstimated Value: $286,000 - $337,365
3
Beds
2
Baths
2,620
Sq Ft
$121/Sq Ft
Est. Value
About This Home
This home is located at 7517 Forsythe Rd SW, Albuquerque, NM 87121 and is currently estimated at $317,091, approximately $121 per square foot. 7517 Forsythe Rd SW is a home located in Bernalillo County with nearby schools including Helen Cordero Primary School, Edward Gonzales Elementary School, and Jimmy Carter Middle School.
Ownership History
Date
Name
Owned For
Owner Type
Purchase Details
Closed on
Jul 16, 2020
Sold by
Chavez Ronald
Bought by
Chavez Ronny Robert
Current Estimated Value
Home Financials for this Owner
Home Financials are based on the most recent Mortgage that was taken out on this home.
Original Mortgage
$145,000
Interest Rate
1.82%
Mortgage Type
Land Contract Argmt. Of Sale
Purchase Details
Closed on
Jul 14, 2020
Sold by
Chavez Debbie D and Chavez Debra
Bought by
Chavez Ronald
Home Financials for this Owner
Home Financials are based on the most recent Mortgage that was taken out on this home.
Original Mortgage
$145,000
Interest Rate
1.82%
Mortgage Type
Land Contract Argmt. Of Sale
Purchase Details
Closed on
Jun 16, 2020
Sold by
Chavez Ronald
Bought by
Chavez Ronny Robert
Home Financials for this Owner
Home Financials are based on the most recent Mortgage that was taken out on this home.
Original Mortgage
$145,000
Interest Rate
1.82%
Mortgage Type
Land Contract Argmt. Of Sale
Create a Home Valuation Report for This Property
The Home Valuation Report is an in-depth analysis detailing your home's value as well as a comparison with similar homes in the area
Home Values in the Area
Average Home Value in this Area
Purchase History
| Date | Buyer | Sale Price | Title Company |
|---|---|---|---|
| Chavez Ronny Robert | -- | Fidelity National Title | |
| Chavez Ronald | -- | None Available | |
| Chavez Ronny Robert | $145,000 | None Available |
Source: Public Records
Mortgage History
| Date | Status | Borrower | Loan Amount |
|---|---|---|---|
| Previous Owner | Chavez Ronny Robert | $145,000 |
Source: Public Records
Tax History Compared to Growth
Tax History
| Year | Tax Paid | Tax Assessment Tax Assessment Total Assessment is a certain percentage of the fair market value that is determined by local assessors to be the total taxable value of land and additions on the property. | Land | Improvement |
|---|---|---|---|---|
| 2024 | $2,735 | $64,827 | $9,199 | $55,628 |
| 2023 | $2,770 | $64,827 | $9,199 | $55,628 |
| 2022 | $2,709 | $63,694 | $9,199 | $54,495 |
| 2021 | $2,726 | $64,393 | $9,199 | $55,194 |
| 2020 | $2,195 | $53,165 | $10,663 | $42,502 |
| 2019 | $2,128 | $51,617 | $10,353 | $41,264 |
| 2018 | $2,050 | $51,617 | $10,353 | $41,264 |
| 2017 | $1,984 | $50,114 | $10,052 | $40,062 |
| 2016 | $1,925 | $47,238 | $9,475 | $37,763 |
| 2015 | $45,862 | $45,862 | $9,199 | $36,663 |
| 2014 | $1,882 | $46,329 | $9,199 | $37,130 |
| 2013 | -- | $46,312 | $7,435 | $38,877 |
Source: Public Records
Map
Nearby Homes
- 7535 Via Tranquilo SW
- 7605 Via Belleza SW
- 7524 Via Belleza SW
- 7612 Via Belleza SW
- 424 Whitethorn St SW
- 412 Sesame St SW
- 0 Bridge Blvd SW
- 220 Flip Ln SW
- Wellton Plan at Estrella at High Range
- Mesquite Plan at Estrella at High Range
- Bisbee Plan at Estrella at High Range
- Somerton Plan at Estrella at High Range
- Bennett Plan at Estrella at High Range
- Payson Plan at Villa De Marcos Gabriel
- 961 Berman St SW
- 427 Bluethorn Ct SW
- 527 Whisper Mesa St SW
- 420 69th St SW
- 8009 Vista Estrella Ln SW
- 0 Nna Unser&tower SW Unit 1081416
- 7521 Forsythe Rd SW
- 7513 Forsythe Rd SW
- 7516 Gwin Rd SW
- 7520 Gwin Rd SW
- 7509 Forsythe Rd SW
- 7512 Gwin Rd SW
- 7525 Forsythe Rd SW
- 7524 Gwin Rd SW
- 7508 Gwin Rd SW
- 7516 Forsythe Rd SW
- 7512 Forsythe Rd SW
- 7520 Forsythe Rd SW
- 7505 Forsythe Rd SW
- 7529 Forsythe Rd SW
- 7524 Forsythe Rd SW
- 7528 Gwin Rd SW
- 7504 Gwin Rd SW
- 7528 Forsythe Rd SW
- 7508 Forsythe Rd SW
- 7521 Gwin Rd SW