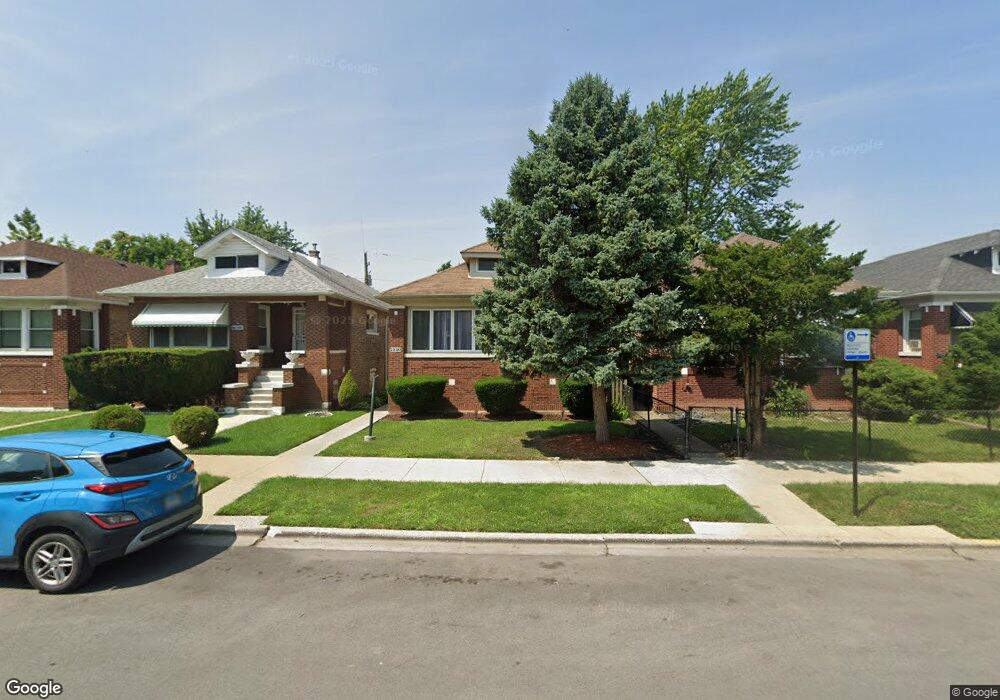
7518 S Morgan St Chicago, IL 60620
Auburn Gresham NeighborhoodEstimated Value: $141,000 - $188,004
3
Beds
1
Bath
1,176
Sq Ft
$135/Sq Ft
Est. Value
About This Home
This home is located at 7518 S Morgan St, Chicago, IL 60620 and is currently estimated at $158,751, approximately $134 per square foot. 7518 S Morgan St is a home located in Cook County with nearby schools including Stagg Elementary School, Bogan Computer Technical High School, and Community Youth Development Institute.
Ownership History
Date
Name
Owned For
Owner Type
Purchase Details
Closed on
Nov 17, 2005
Sold by
Patrick Nancy J
Bought by
Patrick Eric and Patrick Nancy J
Current Estimated Value
Purchase Details
Closed on
Mar 29, 1998
Sold by
Cole Taylor Bank
Bought by
Patrick Nancy J
Home Financials for this Owner
Home Financials are based on the most recent Mortgage that was taken out on this home.
Original Mortgage
$76,227
Outstanding Balance
$14,597
Interest Rate
7.2%
Mortgage Type
FHA
Estimated Equity
$144,154
Purchase Details
Closed on
Dec 2, 1997
Sold by
Bankers Trust Company
Bought by
Cole Taylor Bank and Trust #4852
Purchase Details
Closed on
Jul 10, 1997
Sold by
Sheahan Michael F
Bought by
Bankers Trust Company and Dlj Mtg Acceptance Corp Mtg Pass Through
Purchase Details
Closed on
Nov 18, 1994
Sold by
Five Avco Financial Services Inc
Bought by
Jordan Bernestine and Jordan Ophia
Home Financials for this Owner
Home Financials are based on the most recent Mortgage that was taken out on this home.
Original Mortgage
$49,125
Interest Rate
9.24%
Create a Home Valuation Report for This Property
The Home Valuation Report is an in-depth analysis detailing your home's value as well as a comparison with similar homes in the area
Home Values in the Area
Average Home Value in this Area
Purchase History
| Date | Buyer | Sale Price | Title Company |
|---|---|---|---|
| Patrick Eric | -- | -- | |
| Patrick Nancy J | $77,000 | Intercounty Title | |
| Cole Taylor Bank | $37,000 | -- | |
| Bankers Trust Company | -- | -- | |
| Jordan Bernestine | $41,500 | -- |
Source: Public Records
Mortgage History
| Date | Status | Borrower | Loan Amount |
|---|---|---|---|
| Open | Patrick Nancy J | $76,227 | |
| Previous Owner | Jordan Bernestine | $49,125 |
Source: Public Records
Tax History Compared to Growth
Tax History
| Year | Tax Paid | Tax Assessment Tax Assessment Total Assessment is a certain percentage of the fair market value that is determined by local assessors to be the total taxable value of land and additions on the property. | Land | Improvement |
|---|---|---|---|---|
| 2024 | $2,254 | $11,000 | $1,875 | $9,125 |
| 2023 | $2,176 | $14,001 | $2,438 | $11,563 |
| 2022 | $2,176 | $14,001 | $2,438 | $11,563 |
| 2021 | $2,145 | $13,999 | $2,437 | $11,562 |
| 2020 | $1,585 | $10,216 | $2,437 | $7,779 |
| 2019 | $1,567 | $11,227 | $2,437 | $8,790 |
| 2018 | $1,539 | $11,227 | $2,437 | $8,790 |
| 2017 | $1,750 | $11,503 | $2,250 | $9,253 |
| 2016 | $1,804 | $11,503 | $2,250 | $9,253 |
| 2015 | $1,627 | $11,503 | $2,250 | $9,253 |
| 2014 | $1,596 | $11,172 | $2,062 | $9,110 |
| 2013 | $1,554 | $11,172 | $2,062 | $9,110 |
Source: Public Records
Map
Nearby Homes
- 7534 S Morgan St
- 7529 S Carpenter St
- 7601 S Morgan St
- 7535 S Aberdeen St
- 7611 S Aberdeen St
- 7528 S Peoria St
- 7520 S Aberdeen St
- 7512 S Peoria St
- 7542 S Peoria St
- 7645 S Morgan St
- 7545 S May St
- 7630 S Peoria St
- 7411 S Morgan St
- 7520 S May St
- 7504 S Green St
- 7517 S Green St
- 7515 S Green St
- 7650 S May St
- 7629 S Green St
- 7335 S Morgan St
- 7516 S Morgan St
- 7522 S Morgan St
- 7512 S Morgan St
- 7524 S Morgan St
- 7510 S Morgan St
- 7528 S Morgan St
- 7506 S Morgan St
- 7532 S Morgan St
- 7519 S Carpenter St
- 7517 S Carpenter St
- 7523 S Carpenter St
- 7502 S Morgan St
- 7515 S Carpenter St
- 7525 S Carpenter St
- 7523 S Morgan St Unit 1
- 7511 S Carpenter St
- 7500 S Morgan St
- 7507 S Carpenter St
- 7533 S Carpenter St
- 7519 S Morgan St