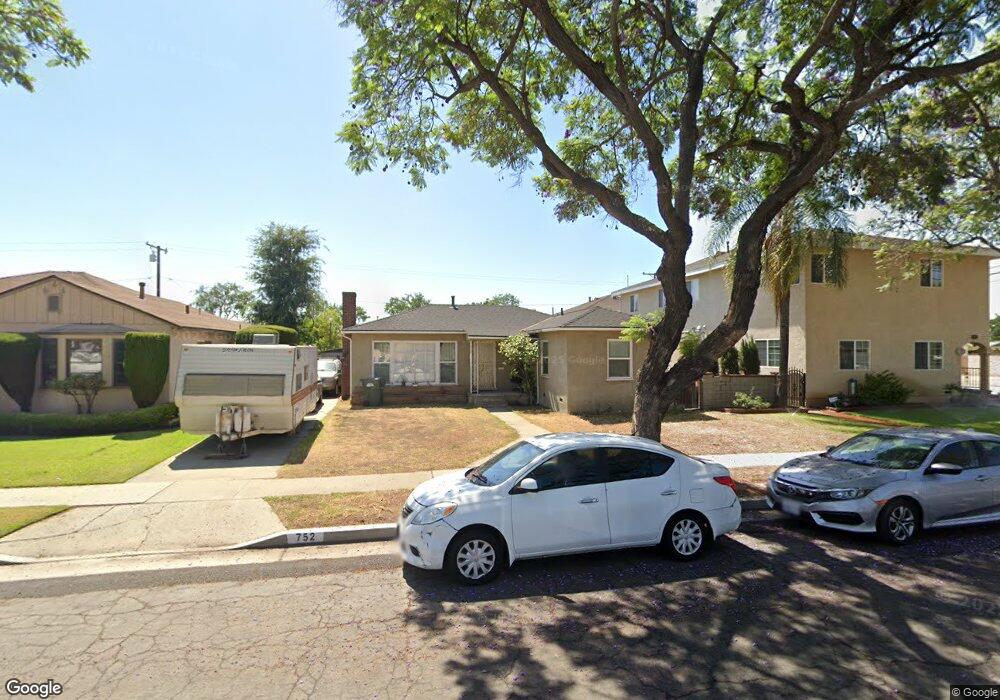
752 S Spruce St Montebello, CA 90640
Estimated Value: $738,829 - $798,000
2
Beds
1
Bath
1,072
Sq Ft
$725/Sq Ft
Est. Value
About This Home
This home is located at 752 S Spruce St, Montebello, CA 90640 and is currently estimated at $777,457, approximately $725 per square foot. 752 S Spruce St is a home located in Los Angeles County with nearby schools including Greenwood Elementary School, Montebello Intermediate School, and Montebello High School.
Ownership History
Date
Name
Owned For
Owner Type
Purchase Details
Closed on
Dec 5, 2006
Sold by
Flores Eloy
Bought by
Flores Martha
Current Estimated Value
Purchase Details
Closed on
Aug 6, 1998
Sold by
U S Bank National
Bought by
Flores Eloy and Flores Martha
Home Financials for this Owner
Home Financials are based on the most recent Mortgage that was taken out on this home.
Original Mortgage
$152,198
Outstanding Balance
$31,751
Interest Rate
6.92%
Mortgage Type
FHA
Estimated Equity
$745,706
Purchase Details
Closed on
Jun 14, 1998
Sold by
Washington Mutual Bank Fa
Bought by
Us Bank National Assn and First Bank National Assn
Home Financials for this Owner
Home Financials are based on the most recent Mortgage that was taken out on this home.
Original Mortgage
$152,198
Outstanding Balance
$31,751
Interest Rate
6.92%
Mortgage Type
FHA
Estimated Equity
$745,706
Purchase Details
Closed on
Mar 16, 1998
Sold by
Mauries Roal
Bought by
U S Bank National and First Bank National
Create a Home Valuation Report for This Property
The Home Valuation Report is an in-depth analysis detailing your home's value as well as a comparison with similar homes in the area
Home Values in the Area
Average Home Value in this Area
Purchase History
| Date | Buyer | Sale Price | Title Company |
|---|---|---|---|
| Flores Martha | -- | Accommodation | |
| Flores Eloy | $155,000 | Investors Title Company | |
| Us Bank National Assn | -- | Investors Title Company | |
| U S Bank National | $179,062 | Stewart Title |
Source: Public Records
Mortgage History
| Date | Status | Borrower | Loan Amount |
|---|---|---|---|
| Open | Flores Eloy | $152,198 |
Source: Public Records
Tax History
| Year | Tax Paid | Tax Assessment Tax Assessment Total Assessment is a certain percentage of the fair market value that is determined by local assessors to be the total taxable value of land and additions on the property. | Land | Improvement |
|---|---|---|---|---|
| 2025 | $3,958 | $242,968 | $150,799 | $92,169 |
| 2024 | $3,958 | $238,205 | $147,843 | $90,362 |
| 2023 | $3,936 | $233,536 | $144,945 | $88,591 |
| 2022 | $3,805 | $228,957 | $142,103 | $86,854 |
| 2021 | $3,665 | $224,468 | $139,317 | $85,151 |
| 2019 | $3,492 | $217,812 | $135,186 | $82,626 |
| 2018 | $3,462 | $213,542 | $132,536 | $81,006 |
| 2016 | $3,315 | $205,252 | $127,391 | $77,861 |
| 2015 | $3,150 | $202,170 | $125,478 | $76,692 |
| 2014 | $3,113 | $198,211 | $123,021 | $75,190 |
Source: Public Records
Map
Nearby Homes
- 813 S Spruce St
- 805 S 10th St
- 649 S 5th St
- 604 S Greenwood Ave
- 915 Carob Way Unit 3
- 841 S Greenwood Ave Unit D
- 932 S Montebello Blvd
- 724 S Taylor Ave
- 608 Davis Ave
- 524 Washington Blvd
- 415 S 6th St
- 630 S Maple Ave Unit 7
- 405 S Bluff Rd
- 740 Albee St
- 252 S 7th St
- 229 S 10th St
- 219 S Greenwood Ave
- 825 Date St
- 1148 S Maple Ave
- 6449 Triton Dr
- 748 S Spruce St
- 756 S Spruce St
- 744 S Spruce St
- 753 S Montebello Blvd
- 749 S Montebello Blvd
- 800 Beach St
- 740 S Spruce St
- 800 S Spruce St
- 745 S Montebello Blvd
- 753 S Spruce St
- 749 S Spruce St
- 757 S Spruce St
- 736 S Spruce St
- 741 S Montebello Blvd
- 801 S Montebello Blvd
- 804 S Spruce St
- 745 S Spruce St
- 610 W Beech St
- 737 S Montebello Blvd
- 741 S Spruce St
Your Personal Tour Guide
Ask me questions while you tour the home.