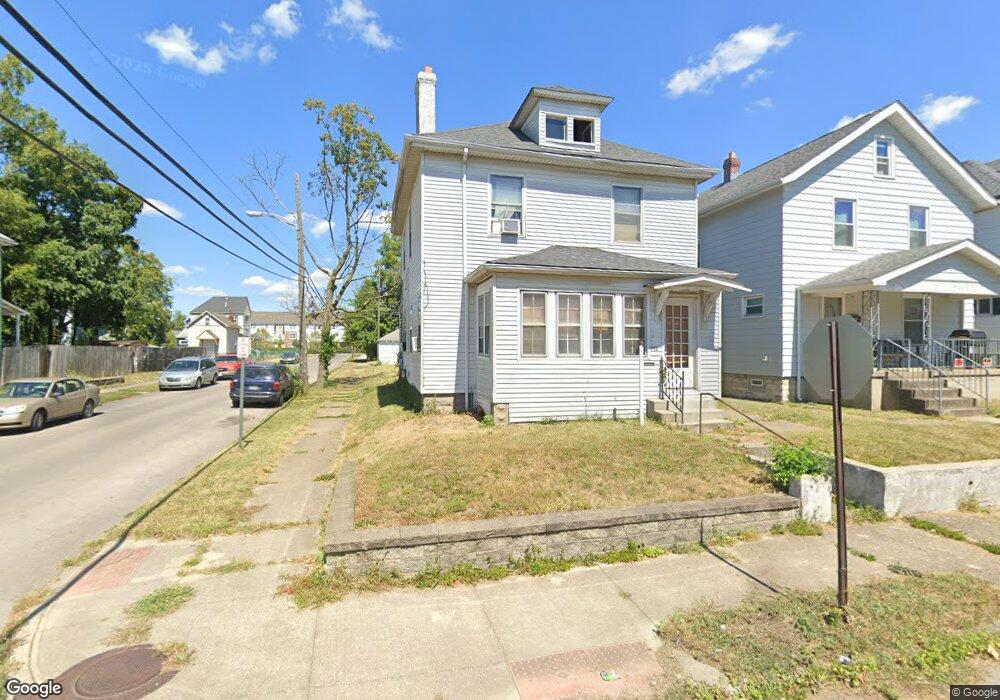
752 Siebert St Unit 754 Columbus, OH 43206
Karns Park NeighborhoodEstimated Value: $209,406 - $322,000
3
Beds
2
Baths
1,446
Sq Ft
$183/Sq Ft
Est. Value
About This Home
This home is located at 752 Siebert St Unit 754, Columbus, OH 43206 and is currently estimated at $264,852, approximately $183 per square foot. 752 Siebert St Unit 754 is a home located in Franklin County with nearby schools including Livingston Elementary School, South High School, and South Columbus Preparatory Academy.
Ownership History
Date
Name
Owned For
Owner Type
Purchase Details
Closed on
Nov 23, 2015
Sold by
Wingo Brian and Wingo Chanda
Bought by
Eagle Signature Service Llc
Current Estimated Value
Purchase Details
Closed on
Apr 14, 2011
Sold by
Fannie Mae
Bought by
Wingo Brian and Wingo Chanda
Purchase Details
Closed on
Jan 31, 2011
Sold by
Campbell Bonnie M
Bought by
Federal National Mortgage Association
Purchase Details
Closed on
Mar 1, 2008
Sold by
Campbell Bonnie
Bought by
Murphy Barbara
Home Financials for this Owner
Home Financials are based on the most recent Mortgage that was taken out on this home.
Original Mortgage
$89,500
Interest Rate
5.74%
Mortgage Type
Seller Take Back
Purchase Details
Closed on
May 16, 1985
Bought by
Campbell Bonnie M
Create a Home Valuation Report for This Property
The Home Valuation Report is an in-depth analysis detailing your home's value as well as a comparison with similar homes in the area
Home Values in the Area
Average Home Value in this Area
Purchase History
| Date | Buyer | Sale Price | Title Company |
|---|---|---|---|
| Eagle Signature Service Llc | $12,000 | Attorney | |
| Wingo Brian | $6,800 | Nova Title | |
| Federal National Mortgage Association | $28,000 | None Available | |
| Murphy Barbara | $89,500 | None Available | |
| Campbell Bonnie M | $33,900 | -- |
Source: Public Records
Mortgage History
| Date | Status | Borrower | Loan Amount |
|---|---|---|---|
| Previous Owner | Murphy Barbara | $89,500 |
Source: Public Records
Tax History
| Year | Tax Paid | Tax Assessment Tax Assessment Total Assessment is a certain percentage of the fair market value that is determined by local assessors to be the total taxable value of land and additions on the property. | Land | Improvement |
|---|---|---|---|---|
| 2025 | $3,175 | $69,270 | $20,970 | $48,300 |
| 2024 | $3,175 | $69,270 | $20,970 | $48,300 |
| 2023 | $3,135 | $69,265 | $20,965 | $48,300 |
| 2022 | $1,159 | $21,810 | $5,040 | $16,770 |
| 2021 | $1,161 | $21,810 | $5,040 | $16,770 |
| 2020 | $1,163 | $21,810 | $5,040 | $16,770 |
| 2019 | $1,043 | $16,770 | $3,890 | $12,880 |
| 2018 | $920 | $16,770 | $3,890 | $12,880 |
| 2017 | $966 | $16,770 | $3,890 | $12,880 |
| 2016 | $890 | $12,120 | $3,120 | $9,000 |
| 2015 | $800 | $12,120 | $3,120 | $9,000 |
| 2014 | $751 | $12,120 | $3,120 | $9,000 |
| 2013 | $478 | $12,740 | $3,290 | $9,450 |
Source: Public Records
Map
Nearby Homes
- 790 Siebert St
- 000 Gilbert St
- 00 Gilbert St
- 735 Reinhard Ave
- 1226-1228 Gilbert St
- 1230 Gilbert St Unit 2
- 779-781 Stanley Ave
- 1174-1176 S 22nd St
- 883 E Whittier St
- 693 Thurman Ave
- 1263 Heyl Ave
- 960 Carpenter St
- 999 S 22nd St
- 640 E Whittier St
- 1196 S Ohio Ave
- 650 E Mithoff St
- 798 E Mithoff St
- 550 Stewart Ave
- 524 Thurman Ave
- 1229-1231 S Champion Ave
- 756 Siebert St
- 760 Siebert St
- 740 Siebert St Unit 742
- 766 Siebert St
- 738 Siebert St
- 768 Siebert St Unit 770
- 768 Siebert St Unit 768
- 768 Siebert St Unit 70
- 734 Siebert St
- 1058 Heyl Ave
- 774 Siebert St
- 730 Siebert St
- 751 Heyl Ave
- 769 Reinhard Ave
- 751 Reinhard Ave
- 751 Reinhard Ave Unit 751 1/2
- 751 Reinhard Ave Unit 751 & 751 1/2
- 749 Siebert St
- 773 Reinhard Ave
- 755 Siebert St
Your Personal Tour Guide
Ask me questions while you tour the home.