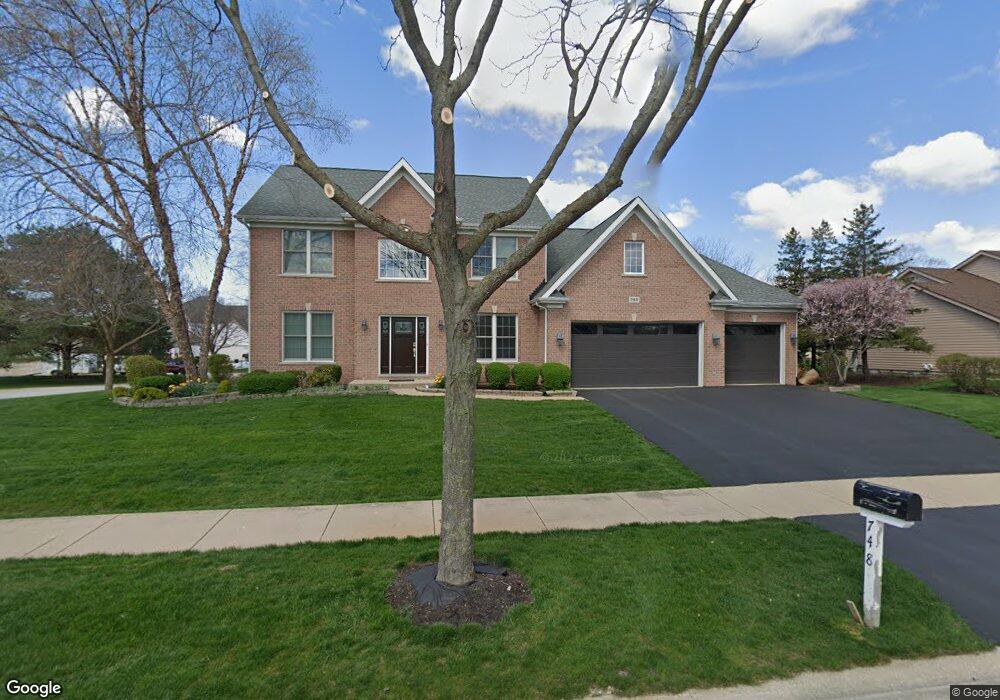
752 Tudor Ct Sugar Grove, IL 60554
Estimated Value: $504,000 - $569,000
--
Bed
--
Bath
2,746
Sq Ft
$198/Sq Ft
Est. Value
About This Home
This home is located at 752 Tudor Ct, Sugar Grove, IL 60554 and is currently estimated at $543,274, approximately $197 per square foot. 752 Tudor Ct is a home located in Kane County with nearby schools including Kaneland Mcdole Elementary School, Harter Middle School, and Kaneland High School.
Ownership History
Date
Name
Owned For
Owner Type
Purchase Details
Closed on
Jun 14, 2012
Sold by
Us Bank National Assn
Bought by
Draves Scott F
Current Estimated Value
Home Financials for this Owner
Home Financials are based on the most recent Mortgage that was taken out on this home.
Original Mortgage
$191,600
Interest Rate
3.87%
Mortgage Type
New Conventional
Purchase Details
Closed on
Jan 23, 2012
Sold by
Mordkovich Vadim and Mordkovich Carmella R
Bought by
U S Bank National Association
Purchase Details
Closed on
Nov 23, 2004
Sold by
Oconnor Homes Llc
Bought by
Mordkovich Vajim and Mordkovich Carmella R
Home Financials for this Owner
Home Financials are based on the most recent Mortgage that was taken out on this home.
Original Mortgage
$297,500
Interest Rate
7.74%
Mortgage Type
Purchase Money Mortgage
Purchase Details
Closed on
Aug 2, 2002
Sold by
Oliver Hoffmann Corp
Bought by
Oconnor Homes Llc
Create a Home Valuation Report for This Property
The Home Valuation Report is an in-depth analysis detailing your home's value as well as a comparison with similar homes in the area
Home Values in the Area
Average Home Value in this Area
Purchase History
| Date | Buyer | Sale Price | Title Company |
|---|---|---|---|
| Draves Scott F | $239,500 | Fidelity National Title | |
| U S Bank National Association | -- | None Available | |
| Mordkovich Vajim | $350,000 | Chicago Title Insurance Comp | |
| Oconnor Homes Llc | $72,000 | Chicago Title Insurance Co |
Source: Public Records
Mortgage History
| Date | Status | Borrower | Loan Amount |
|---|---|---|---|
| Previous Owner | Draves Scott F | $191,600 | |
| Previous Owner | Mordkovich Vajim | $297,500 |
Source: Public Records
Tax History Compared to Growth
Tax History
| Year | Tax Paid | Tax Assessment Tax Assessment Total Assessment is a certain percentage of the fair market value that is determined by local assessors to be the total taxable value of land and additions on the property. | Land | Improvement |
|---|---|---|---|---|
| 2024 | $12,062 | $150,104 | $32,234 | $117,870 |
| 2023 | $11,672 | $135,375 | $29,071 | $106,304 |
| 2022 | $11,217 | $124,977 | $26,838 | $98,139 |
| 2021 | $10,813 | $118,936 | $25,541 | $93,395 |
| 2020 | $10,661 | $116,398 | $24,996 | $91,402 |
| 2019 | $10,498 | $112,593 | $24,179 | $88,414 |
| 2018 | $10,863 | $113,609 | $24,242 | $89,367 |
| 2017 | $10,534 | $108,499 | $23,152 | $85,347 |
| 2016 | $10,287 | $103,718 | $22,132 | $81,586 |
| 2015 | $8,945 | $96,500 | $20,592 | $75,908 |
| 2014 | $8,945 | $92,274 | $19,690 | $72,584 |
| 2013 | $8,945 | $93,244 | $19,897 | $73,347 |
Source: Public Records
Map
Nearby Homes
- 868 Edgewood Dr
- 933 Lakeridge Ct
- 947 Lakeridge Ct
- 954 Black Walnut Dr
- 905 Merrill New Rd
- 778 Black Walnut Ct
- 781 Manor Hill Place
- 684 Greenfield Rd
- 757 Merrill New Rd Unit 7
- 706 Brighton Dr
- 693 Greenfield Rd
- 670 Sheffield Cir
- 7 Douglas Dr Unit 3
- 611 Pine St
- 352 Normandie Dr
- 6 Saddlewood Ct
- 11 Hardwick Ct
- 8 Mossfield Ct
- 1070 Wheatfield Ave
- 1155 Mcdole Dr
- 748 Queens Gate Cir
- 754 Queens Gate Cir Unit 1
- 747 Queens Gate Cir
- 749 Queens Gate Cir
- 756 Pembridge Place Unit 1
- 740 Queens Gate Cir Unit 1
- 748 Tudor Ct Unit 1
- 754 Pembridge Place
- 751 Queens Gate Cir Unit 1
- 746 Tudor Ct Unit 1
- 753 Queens Gate Cir
- 742 Tudor Ct
- 744 Tudor Ct Unit 1
- 887 Edgewood Dr
- 752 Pembridge Place Unit 1
- 883 Edgewood Dr
- 893 Edgewood Dr
- 881 Edgewood Dr
- 814 Queens Gate Cir Unit 1
- 899 Edgewood Dr