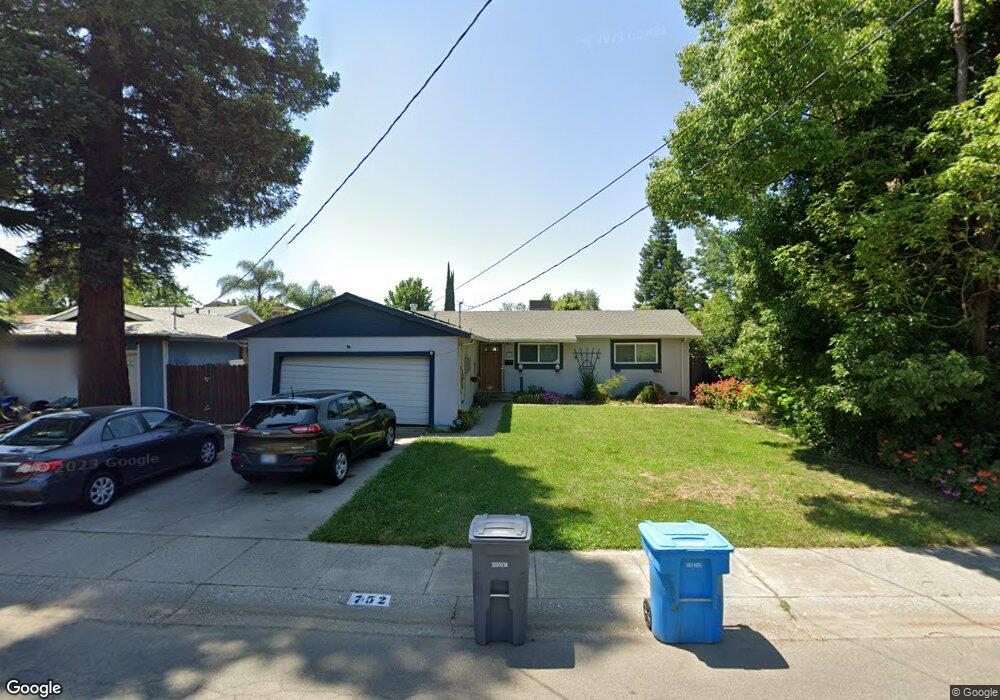
752 Woodhurst Ct Yuba City, CA 95991
Estimated Value: $386,000 - $412,000
3
Beds
2
Baths
1,488
Sq Ft
$271/Sq Ft
Est. Value
About This Home
This home is located at 752 Woodhurst Ct, Yuba City, CA 95991 and is currently estimated at $403,128, approximately $270 per square foot. 752 Woodhurst Ct is a home located in Sutter County with nearby schools including Park Avenue Elementary School, Gray Avenue Middle School, and Yuba City High School.
Ownership History
Date
Name
Owned For
Owner Type
Purchase Details
Closed on
Apr 7, 2009
Sold by
North David W
Bought by
North Judith A
Current Estimated Value
Home Financials for this Owner
Home Financials are based on the most recent Mortgage that was taken out on this home.
Original Mortgage
$210,000
Outstanding Balance
$121,968
Interest Rate
3.47%
Mortgage Type
Reverse Mortgage Home Equity Conversion Mortgage
Estimated Equity
$281,160
Purchase Details
Closed on
Sep 14, 2006
Sold by
Cooper Ruth Ellen
Bought by
North Ruth Ellen
Purchase Details
Closed on
Oct 24, 2005
Sold by
Kadel William L and Kadel Lori Ann
Bought by
Cooper Ruth Ellen
Home Financials for this Owner
Home Financials are based on the most recent Mortgage that was taken out on this home.
Original Mortgage
$105,000
Interest Rate
5.68%
Mortgage Type
Fannie Mae Freddie Mac
Create a Home Valuation Report for This Property
The Home Valuation Report is an in-depth analysis detailing your home's value as well as a comparison with similar homes in the area
Home Values in the Area
Average Home Value in this Area
Purchase History
| Date | Buyer | Sale Price | Title Company |
|---|---|---|---|
| North Judith A | -- | Accommodation | |
| North Ruth Ellen | $257,000 | North State Title Company | |
| Cooper Ruth Ellen | $275,000 | North State Title Company |
Source: Public Records
Mortgage History
| Date | Status | Borrower | Loan Amount |
|---|---|---|---|
| Open | North Judith A | $210,000 | |
| Previous Owner | Cooper Ruth Ellen | $105,000 |
Source: Public Records
Tax History Compared to Growth
Tax History
| Year | Tax Paid | Tax Assessment Tax Assessment Total Assessment is a certain percentage of the fair market value that is determined by local assessors to be the total taxable value of land and additions on the property. | Land | Improvement |
|---|---|---|---|---|
| 2025 | $3,785 | $344,305 | $120,572 | $223,733 |
| 2024 | $3,785 | $337,555 | $118,208 | $219,347 |
| 2023 | $3,785 | $330,938 | $115,891 | $215,047 |
| 2022 | $3,585 | $320,000 | $100,000 | $220,000 |
| 2021 | $3,221 | $285,000 | $95,000 | $190,000 |
| 2020 | $2,806 | $250,000 | $85,000 | $165,000 |
| 2019 | $2,521 | $225,000 | $65,000 | $160,000 |
| 2018 | $2,254 | $200,000 | $50,000 | $150,000 |
| 2017 | $2,085 | $185,900 | $42,900 | $143,000 |
| 2016 | $1,896 | $169,000 | $39,000 | $130,000 |
| 2015 | $1,760 | $157,000 | $35,000 | $122,000 |
| 2014 | $1,661 | $147,000 | $30,000 | $117,000 |
Source: Public Records
Map
Nearby Homes
- 764 Woodhurst Ct
- 740 Woodhurst Ct
- 728 Woodhurst Ct
- 776 Woodhurst Ct
- 785 Sherwood Dr
- 751 Sherwood Dr
- 716 Woodhurst Ct
- 786 Woodhurst Ct
- 796 Woodhurst Ct
- 801 Sherwood Dr
- 703 Woodhurst Ct
- 120 Park Ave
- 741 Sherwood Dr
- 416 Windsor Dr
- 756 Sherwood Dr
- 4 Oak Hollow Dr
- 409 Windsor Dr
- 5 Oak Hollow Dr
- 748 Sherwood Dr
- 121 Park Ave