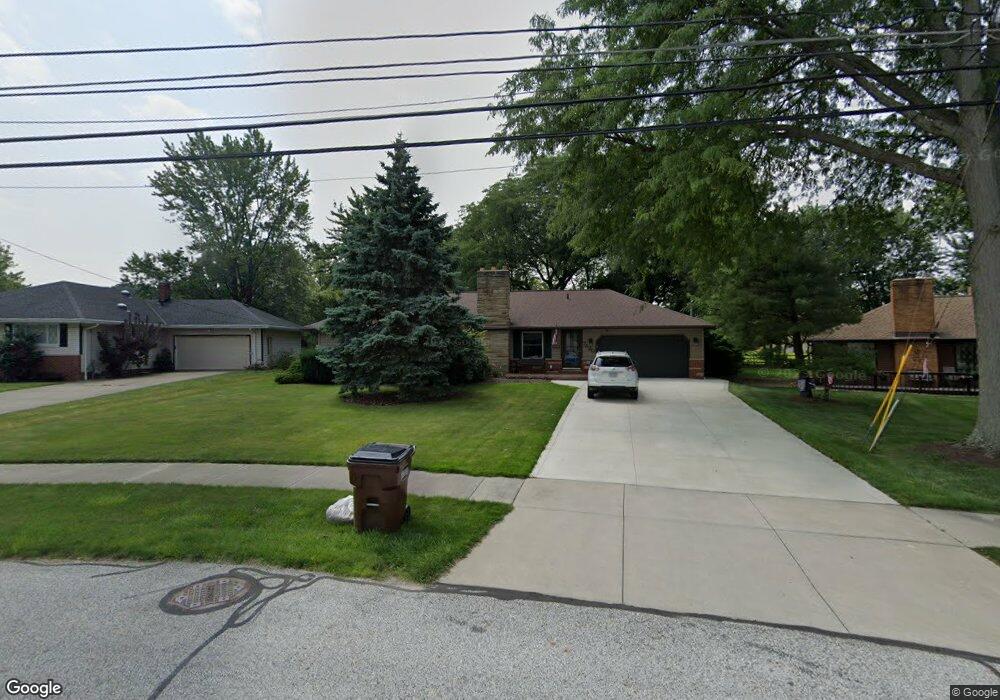
7520 Bradenton Blvd Cleveland, OH 44134
Estimated Value: $200,000 - $303,000
3
Beds
2
Baths
1,376
Sq Ft
$180/Sq Ft
Est. Value
About This Home
This home is located at 7520 Bradenton Blvd, Cleveland, OH 44134 and is currently estimated at $248,100, approximately $180 per square foot. 7520 Bradenton Blvd is a home located in Cuyahoga County with nearby schools including Green Valley Elementary School, Normandy High School, and Hillside Middle School.
Ownership History
Date
Name
Owned For
Owner Type
Purchase Details
Closed on
Jan 8, 2020
Sold by
Ostrowski David A
Bought by
Ostrowski David A and Ostrowski Family Trust
Current Estimated Value
Purchase Details
Closed on
Feb 8, 2002
Sold by
Montgomery Charles F and Montgomery Kathleen E
Bought by
Ostrowski David A
Home Financials for this Owner
Home Financials are based on the most recent Mortgage that was taken out on this home.
Original Mortgage
$138,400
Outstanding Balance
$57,429
Interest Rate
7.11%
Estimated Equity
$190,671
Purchase Details
Closed on
Mar 30, 1985
Sold by
Montgomery Charles F
Bought by
Montgomery Charles F
Purchase Details
Closed on
Jun 29, 1979
Sold by
Tiedt Melvin C and E L
Bought by
Montgomery Charles F
Purchase Details
Closed on
Jan 1, 1975
Bought by
Tiedt Melvin C and E L
Create a Home Valuation Report for This Property
The Home Valuation Report is an in-depth analysis detailing your home's value as well as a comparison with similar homes in the area
Home Values in the Area
Average Home Value in this Area
Purchase History
| Date | Buyer | Sale Price | Title Company |
|---|---|---|---|
| Ostrowski David A | -- | None Available | |
| Ostrowski David A | $173,000 | Lawyers Title Ins Corp | |
| Montgomery Charles F | -- | -- | |
| Montgomery Charles F | $72,000 | -- | |
| Tiedt Melvin C | -- | -- |
Source: Public Records
Mortgage History
| Date | Status | Borrower | Loan Amount |
|---|---|---|---|
| Open | Ostrowski David A | $138,400 | |
| Closed | Ostrowski David A | $25,950 |
Source: Public Records
Tax History Compared to Growth
Tax History
| Year | Tax Paid | Tax Assessment Tax Assessment Total Assessment is a certain percentage of the fair market value that is determined by local assessors to be the total taxable value of land and additions on the property. | Land | Improvement |
|---|---|---|---|---|
| 2024 | $4,187 | $68,145 | $16,625 | $51,520 |
| 2023 | $4,037 | $56,950 | $12,080 | $44,870 |
| 2022 | $4,002 | $56,950 | $12,080 | $44,870 |
| 2021 | $4,118 | $56,950 | $12,080 | $44,870 |
| 2020 | $3,904 | $47,850 | $10,150 | $37,700 |
| 2019 | $3,755 | $136,700 | $29,000 | $107,700 |
| 2018 | $3,592 | $47,850 | $10,150 | $37,700 |
| 2017 | $3,700 | $43,790 | $8,650 | $35,140 |
| 2016 | $3,678 | $43,790 | $8,650 | $35,140 |
| 2015 | $3,498 | $43,790 | $8,650 | $35,140 |
| 2014 | $3,498 | $45,160 | $8,930 | $36,230 |
Source: Public Records
Map
Nearby Homes
- 7558 Pleasant View Dr
- 4402 Stary Dr
- 2800 Bonny Blvd
- 3350 Saint Andrews Dr
- 2830 Brian Dr
- 7531 Vista Dr
- 4803 Sassafras Dr
- 4440 Coral Gables Dr
- 7744 Cecelia Dr
- 7791 Hoertz Rd
- 2644 Nottingham Dr
- 7180 Marko Ln
- 3200 Dentzler Rd
- 2330 Judy Dr
- 3610 Jeanne Dr
- 1881 W Pleasant Valley Rd
- 8053 Thornhurst Dr
- 3195 Marda Dr
- 4591 W Sprague Rd
- 7030 Lyle Ave
- 7530 Bradenton Blvd
- 7512 Bradenton Blvd
- 7551 Stary Dr
- 7500 Bradenton Blvd
- 7563 Stary Dr
- 7539 Stary Dr
- 3296 Sunhaven Oval
- 3280 Sunhaven Oval
- 7527 Stary Dr
- 3306 Sunhaven Oval
- 7515 Bradenton Blvd
- 7490 Bradenton Blvd
- 3316 Sunhaven Oval
- 7515 Stary Dr
- 7533 Bradenton Blvd
- 7505 Bradenton Blvd
- 7569 Stary Dr
- 7537 Bradenton Blvd
- 3326 Sunhaven Oval
- 7484 Bradenton Blvd