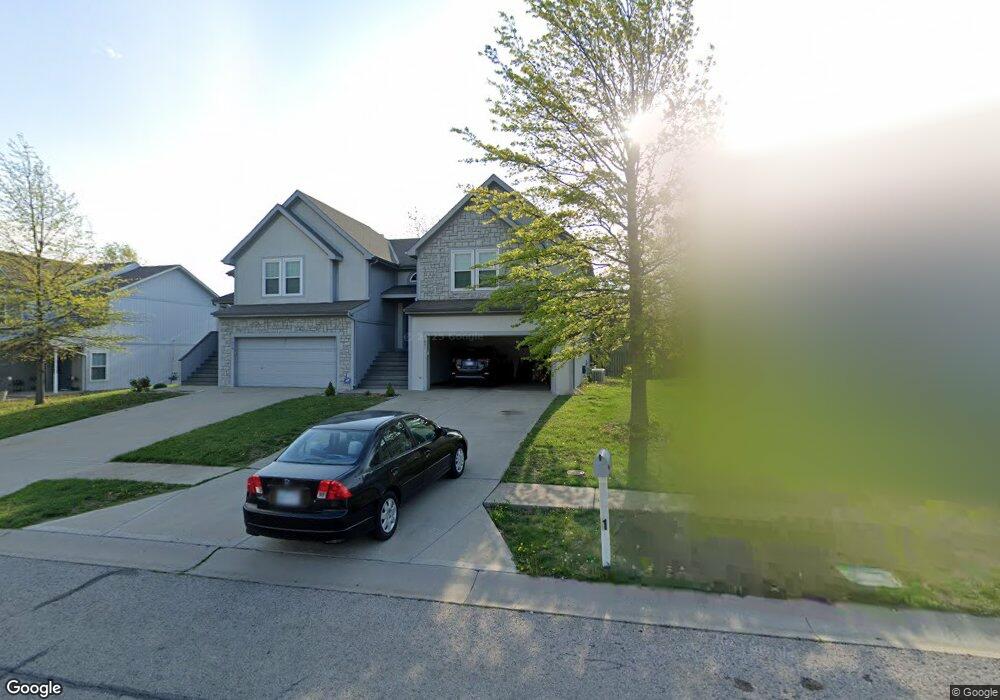
7521 Anderson St Shawnee, KS 66227
Estimated Value: $298,000 - $358,290
3
Beds
3
Baths
1,046
Sq Ft
$311/Sq Ft
Est. Value
About This Home
This home is located at 7521 Anderson St, Shawnee, KS 66227 and is currently estimated at $325,073, approximately $310 per square foot. 7521 Anderson St is a home located in Johnson County with nearby schools including Horizon Elementary School, Mill Creek Middle School, and Mill Valley High School.
Ownership History
Date
Name
Owned For
Owner Type
Purchase Details
Closed on
Jan 8, 2024
Sold by
Muroka Michael
Bought by
Sila Joyce
Current Estimated Value
Purchase Details
Closed on
Nov 9, 2016
Sold by
Sila Joyce Mumbua
Bought by
Muroka Michael and Sila Joyce Mumbua
Purchase Details
Closed on
May 8, 2006
Sold by
Jones Paul G and Jones Judith A
Bought by
Jones Paul G and Jones Judith A
Purchase Details
Closed on
Oct 10, 2003
Sold by
Carl Margaret J
Bought by
Jones Paul G and Jones Judith A
Home Financials for this Owner
Home Financials are based on the most recent Mortgage that was taken out on this home.
Original Mortgage
$114,400
Interest Rate
4.62%
Mortgage Type
Purchase Money Mortgage
Purchase Details
Closed on
Sep 27, 2002
Sold by
Brookside Inc
Bought by
Carl Margaret J
Home Financials for this Owner
Home Financials are based on the most recent Mortgage that was taken out on this home.
Original Mortgage
$111,990
Interest Rate
6.21%
Create a Home Valuation Report for This Property
The Home Valuation Report is an in-depth analysis detailing your home's value as well as a comparison with similar homes in the area
Home Values in the Area
Average Home Value in this Area
Purchase History
| Date | Buyer | Sale Price | Title Company |
|---|---|---|---|
| Sila Joyce | -- | None Listed On Document | |
| Sila Joyce | -- | None Listed On Document | |
| Sila Joyce | -- | None Listed On Document | |
| Muroka Michael | -- | None Available | |
| Jones Paul G | -- | None Available | |
| Jones Paul G | -- | Stewart Title | |
| Carl Margaret J | -- | Stewart Title |
Source: Public Records
Mortgage History
| Date | Status | Borrower | Loan Amount |
|---|---|---|---|
| Previous Owner | Jones Paul G | $114,400 | |
| Previous Owner | Carl Margaret J | $111,990 |
Source: Public Records
Tax History Compared to Growth
Tax History
| Year | Tax Paid | Tax Assessment Tax Assessment Total Assessment is a certain percentage of the fair market value that is determined by local assessors to be the total taxable value of land and additions on the property. | Land | Improvement |
|---|---|---|---|---|
| 2024 | $3,149 | $27,450 | $3,942 | $23,508 |
| 2023 | $3,063 | $26,139 | $3,942 | $22,197 |
| 2022 | $2,931 | $24,495 | $3,151 | $21,344 |
| 2021 | $2,942 | $23,483 | $2,865 | $20,618 |
| 2020 | $2,801 | $22,149 | $2,865 | $19,284 |
| 2019 | $2,809 | $21,885 | $2,865 | $19,020 |
| 2018 | $2,580 | $19,907 | $2,865 | $17,042 |
| 2017 | $2,404 | $18,090 | $2,542 | $15,548 |
| 2016 | $2,369 | $17,607 | $2,542 | $15,065 |
| 2015 | $2,376 | $17,469 | $2,542 | $14,927 |
| 2013 | -- | $16,503 | $2,542 | $13,961 |
Source: Public Records
Map
Nearby Homes
- 22410 W 76th St
- 22408 W 76th St
- 22312 W 76th St
- 22310 W 76th St
- 9309 Aminda St
- 00 75th St
- 000 75th St
- 0000 75th St
- 7342 Mccoy St
- 22707 W 73rd St
- 0 Hedge Lane Terrace
- 23136 W 71st Terrace
- 7153 Meadow View St
- Cypress Plan at Bristol Highlands - The Manors
- Del Mar Front Entry Plan at Bristol Highlands - The Manors
- Del Mar Front Entry Plan at Bristol Highlands - The Estates
- Regency II Plan at Bristol Highlands - The Estates
- Aspen I Plan at Bristol Highlands - The Manors
- The Oakmont Plan at Bristol Highlands - The Estates
- 7323 Meadowsweet Ln
- 7525 Anderson St
- 7519 Anderson St
- 7515 Anderson St
- 7527 Anderson St
- 7513 Anderson St
- 7520 Mccoy St
- 7518 Mccoy St
- 7524 Mccoy St
- 7514 Mccoy St
- 7526 Mccoy St
- 7509 Anderson St
- 7533 Anderson St
- 7520 Anderson St
- 7518 Anderson St
- 7524 Anderson St
- 7514 Anderson St
- 7526 Anderson St
- 7507 Anderson St
- 7508 Mccoy St
- 7530 Anderson St