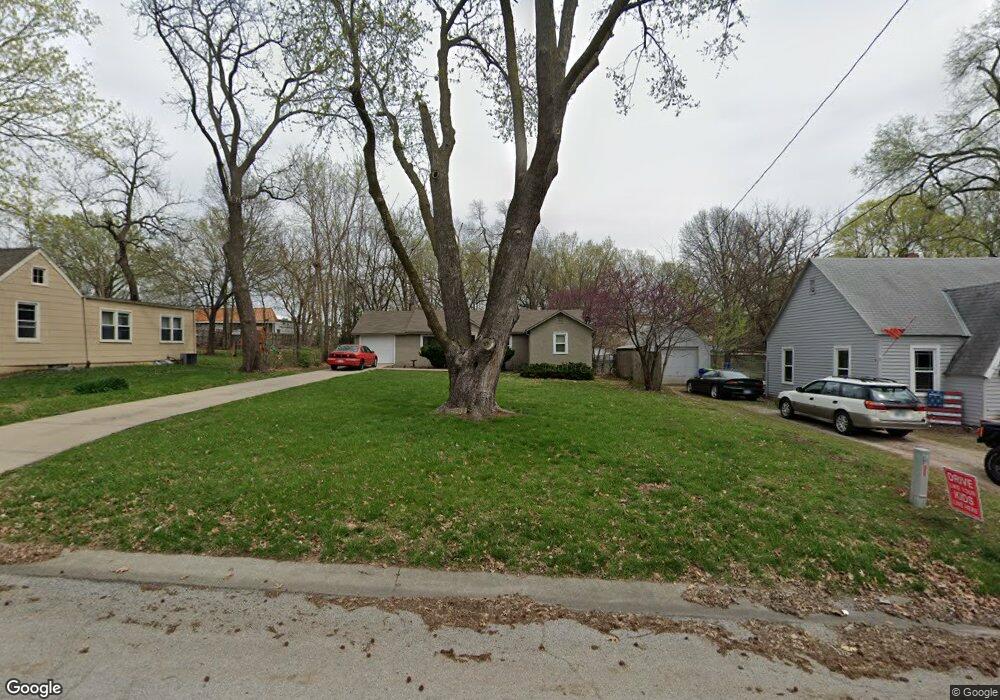
7523 Eby Ln Overland Park, KS 66204
Estimated Value: $248,000 - $258,000
3
Beds
1
Bath
1,023
Sq Ft
$248/Sq Ft
Est. Value
About This Home
This home is located at 7523 Eby Ln, Overland Park, KS 66204 and is currently estimated at $253,211, approximately $247 per square foot. 7523 Eby Ln is a home located in Johnson County with nearby schools including Comanche Elementary School, Westridge Middle School, and Shawnee Mission West High School.
Ownership History
Date
Name
Owned For
Owner Type
Purchase Details
Closed on
Sep 13, 2017
Sold by
Rres Llc
Bought by
Homes 4 U Llc
Current Estimated Value
Purchase Details
Closed on
Mar 14, 2017
Sold by
Ronson Donna
Bought by
Rres Llc
Purchase Details
Closed on
Mar 13, 2017
Sold by
Ronkauk Investment Llc
Bought by
Ronson Donna
Purchase Details
Closed on
Sep 29, 2011
Sold by
Deutsche Bank National Trust Company
Bought by
Ronkauk Investments Llc
Purchase Details
Closed on
May 6, 2010
Sold by
Mccune Kathleen and Mccune Thomas
Bought by
Deutsche Bank National Trust Company
Purchase Details
Closed on
Sep 15, 2006
Sold by
Koziatek Eunice F
Bought by
Mccune Kathleen
Home Financials for this Owner
Home Financials are based on the most recent Mortgage that was taken out on this home.
Original Mortgage
$22,300
Interest Rate
6.46%
Mortgage Type
Stand Alone Second
Create a Home Valuation Report for This Property
The Home Valuation Report is an in-depth analysis detailing your home's value as well as a comparison with similar homes in the area
Home Values in the Area
Average Home Value in this Area
Purchase History
| Date | Buyer | Sale Price | Title Company |
|---|---|---|---|
| Homes 4 U Llc | -- | None Available | |
| Rres Llc | -- | None Available | |
| Ronson Donna | -- | None Available | |
| Ronkauk Investments Llc | -- | None Available | |
| Deutsche Bank National Trust Company | $94,986 | None Available | |
| Mccune Kathleen | -- | Kansas City Title |
Source: Public Records
Mortgage History
| Date | Status | Borrower | Loan Amount |
|---|---|---|---|
| Previous Owner | Mccune Kathleen | $22,300 | |
| Previous Owner | Mccune Kathleen | $89,200 |
Source: Public Records
Tax History Compared to Growth
Tax History
| Year | Tax Paid | Tax Assessment Tax Assessment Total Assessment is a certain percentage of the fair market value that is determined by local assessors to be the total taxable value of land and additions on the property. | Land | Improvement |
|---|---|---|---|---|
| 2024 | $2,326 | $24,667 | $4,332 | $20,335 |
| 2023 | $2,217 | $22,896 | $4,332 | $18,564 |
| 2022 | $2,068 | $21,528 | $3,940 | $17,588 |
| 2021 | $1,909 | $18,734 | $3,940 | $14,794 |
| 2020 | $1,790 | $17,607 | $3,157 | $14,450 |
| 2019 | $1,709 | $16,825 | $3,157 | $13,668 |
| 2018 | $1,643 | $16,112 | $3,157 | $12,955 |
| 2017 | $1,442 | $13,938 | $3,157 | $10,781 |
| 2016 | $1,422 | $13,524 | $3,157 | $10,367 |
| 2015 | $1,345 | $13,087 | $3,149 | $9,938 |
| 2013 | -- | $12,397 | $3,149 | $9,248 |
Source: Public Records
Map
Nearby Homes
- 8708 W 76th Terrace
- 7522 Mackey St
- 7649 Mackey St
- 8401 W 77th St
- 7859 Kessler Ln
- 8713 W 72nd St
- 7909 Grandview St
- 7205 Woodward St
- 7923 Hadley St
- 8037 Grandview Ln
- 7808 W 74th St
- 7139 Hardy St
- 8808 W 81st Terrace
- 7240 Mastin St
- 9312 W 81st Terrace
- 6901 Grandview St
- 8113 Hadley St
- 7305 Robinson St
- 8201 Antioch Rd
- 8101 Goodman St