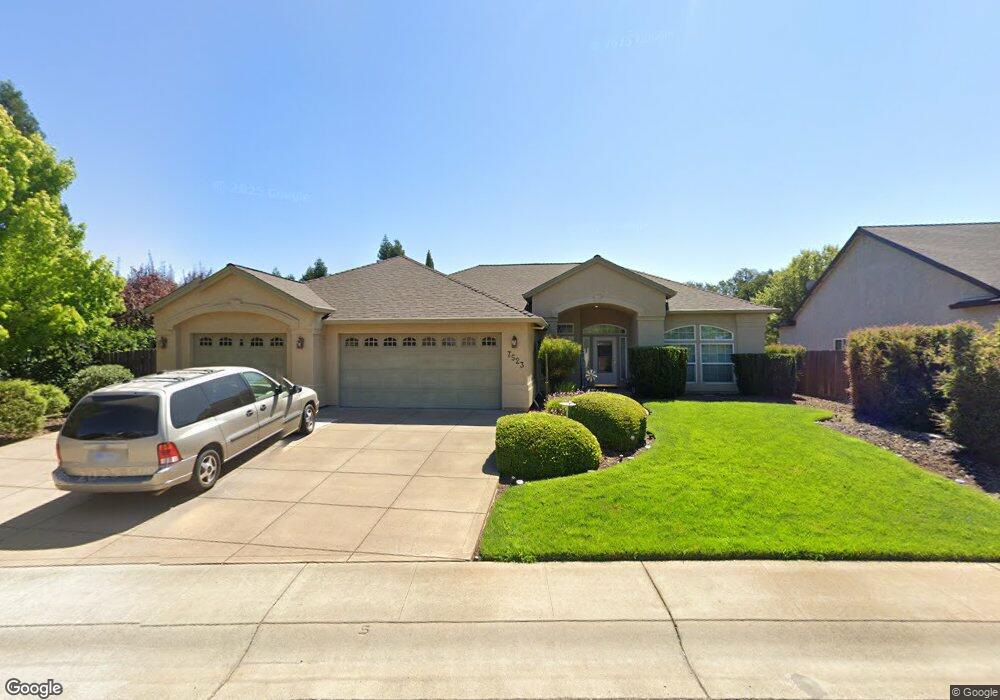
7523 Robles Dr Redding, CA 96002
Estimated Value: $590,912 - $680,000
4
Beds
3
Baths
2,624
Sq Ft
$238/Sq Ft
Est. Value
About This Home
This home is located at 7523 Robles Dr, Redding, CA 96002 and is currently estimated at $623,978, approximately $237 per square foot. 7523 Robles Dr is a home located in Shasta County with nearby schools including Prairie Elementary School, Pacheco Elementary School, and Northern Summit Academy.
Ownership History
Date
Name
Owned For
Owner Type
Purchase Details
Closed on
Jan 17, 2023
Sold by
Wilson Robert and Wilson Patricia
Bought by
Robert M And Patricia A Wilson Revocable Trus and Wilson
Current Estimated Value
Purchase Details
Closed on
Oct 11, 2021
Sold by
Wolph Thomas George and Wolph Margaret Susan
Bought by
Wilson Robert and Wilson Patricia
Home Financials for this Owner
Home Financials are based on the most recent Mortgage that was taken out on this home.
Original Mortgage
$449,250
Interest Rate
2.8%
Mortgage Type
New Conventional
Purchase Details
Closed on
Aug 8, 2011
Sold by
Wolph Thomas G and Wolph Margaret S
Bought by
Wolph Thomas George and Wolph Margaret Susan
Purchase Details
Closed on
May 9, 2006
Sold by
Bergstrom Enterprises Inc
Bought by
Wolph Thomas G and Wolph Margaret S
Purchase Details
Closed on
Apr 27, 2005
Sold by
Meyer Adolph C and Meyer Patricia L
Bought by
Bergstrom Enterprises Inc
Create a Home Valuation Report for This Property
The Home Valuation Report is an in-depth analysis detailing your home's value as well as a comparison with similar homes in the area
Purchase History
| Date | Buyer | Sale Price | Title Company |
|---|---|---|---|
| Robert M And Patricia A Wilson Revocable Trus | -- | None Listed On Document | |
| Wilson Robert | $599,000 | Fidelity Natl Ttl Co Of Ca | |
| Wolph Thomas George | -- | None Available | |
| Wolph Thomas G | $557,000 | Placer Title Company | |
| Bergstrom Enterprises Inc | $1,320,000 | Alliance Title Company |
Source: Public Records
Mortgage History
| Date | Status | Borrower | Loan Amount |
|---|---|---|---|
| Previous Owner | Wilson Robert | $449,250 |
Source: Public Records
Tax History
| Year | Tax Paid | Tax Assessment Tax Assessment Total Assessment is a certain percentage of the fair market value that is determined by local assessors to be the total taxable value of land and additions on the property. | Land | Improvement |
|---|---|---|---|---|
| 2025 | $6,970 | $635,662 | $90,202 | $545,460 |
| 2024 | $6,839 | $623,199 | $88,434 | $534,765 |
| 2023 | $6,839 | $610,980 | $86,700 | $524,280 |
| 2022 | $6,676 | $599,000 | $85,000 | $514,000 |
| 2021 | $5,421 | $485,000 | $85,000 | $400,000 |
| 2020 | $5,411 | $485,000 | $90,000 | $395,000 |
| 2019 | $5,022 | $445,000 | $90,000 | $355,000 |
| 2018 | $4,925 | $445,000 | $90,000 | $355,000 |
| 2017 | $4,815 | $420,000 | $85,000 | $335,000 |
| 2016 | $4,292 | $410,000 | $85,000 | $325,000 |
| 2015 | $4,188 | $370,000 | $85,000 | $285,000 |
| 2014 | $4,165 | $365,000 | $80,000 | $285,000 |
Source: Public Records
Map
Nearby Homes
- 7587 Fiesta Way
- 7100 Amigo Way
- 7213 Amigo Way
- 7235 Amigo Way
- 7273 Amigo Way
- 7520 Lockheed Dr
- 7530 Lockheed Dr
- 7408 Bridge Ln
- 7067 Tucker Ln
- 7036 Tucker Ln
- 0 Milky Way
- 6927 Riata Dr
- 0000 Riata Dr
- 7100 Milky Way
- 0 Lyal Ln
- 0 Villa Ct
- 20350 Hole in One Dr
- 20350 Hole In 1 Dr
- 6950 Riverland Dr Unit 23
- 6950 Riverland Dr Unit 27
- 7513 Robles Dr
- 7533 Robles Dr
- 7526 Robles Dr
- 7503 Robles Dr
- 7544 Robles Dr
- 7508 Robles Dr
- 7543 Robles Dr
- 7475 Robles Dr
- 7553 Robles Dr
- 3156 Goulant Ln
- Lot #7 Goulant Ln Unit RN1
- Lot #9 Goulant Ln Unit RN1
- Lot #08 Goulant Ln
- 7484 Fiesta Way
- 7562 Robles Dr
- 7496 Fiesta Way
- 7580 Robles Dr
- 7480 Fiesta Way
- 7563 Robles Dr
- 3169 Goulant Ln
Your Personal Tour Guide
Ask me questions while you tour the home.