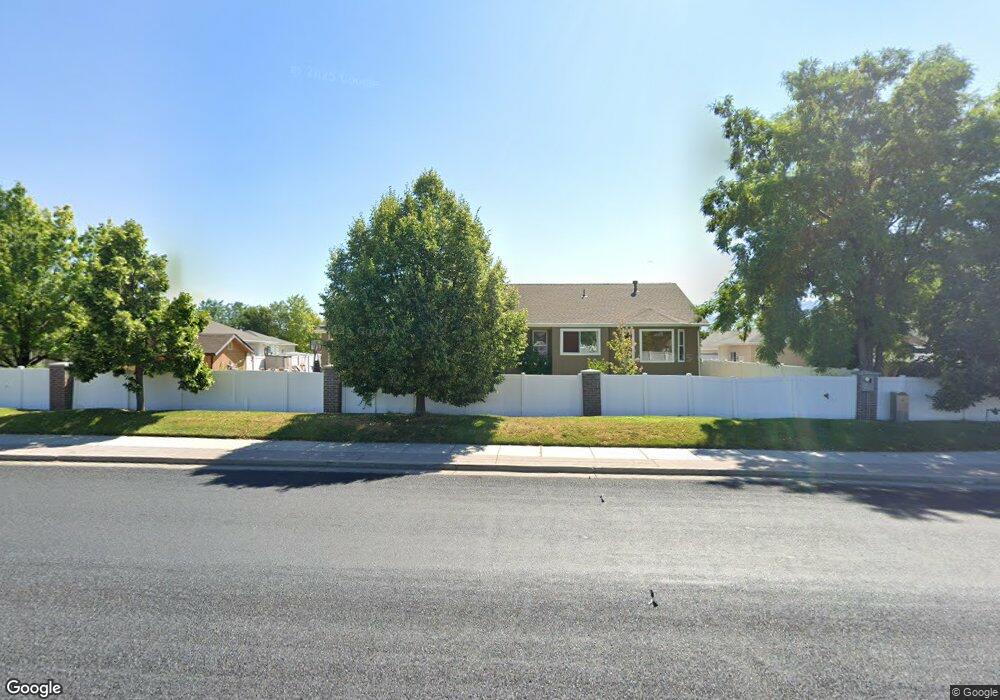
7526 S 5040 W West Jordan, UT 84081
Shadow Mountain NeighborhoodEstimated Value: $603,000 - $635,000
3
Beds
2
Baths
3,035
Sq Ft
$204/Sq Ft
Est. Value
About This Home
This home is located at 7526 S 5040 W, West Jordan, UT 84081 and is currently estimated at $619,539, approximately $204 per square foot. 7526 S 5040 W is a home located in Salt Lake County with nearby schools including Hayden Peak Elementary School, West Hills Middle School, and Copper Hills High School.
Ownership History
Date
Name
Owned For
Owner Type
Purchase Details
Closed on
Jan 2, 2007
Sold by
Foote Christopher L and Foote Channon M
Bought by
Foote Christopher L and Foote Channon M
Current Estimated Value
Home Financials for this Owner
Home Financials are based on the most recent Mortgage that was taken out on this home.
Original Mortgage
$248,000
Outstanding Balance
$145,949
Interest Rate
6.12%
Mortgage Type
New Conventional
Estimated Equity
$473,590
Purchase Details
Closed on
May 2, 2002
Sold by
Dream Livin Custom Homes
Bought by
Foote Christopher L and Foote Channon M
Home Financials for this Owner
Home Financials are based on the most recent Mortgage that was taken out on this home.
Original Mortgage
$209,100
Interest Rate
7.13%
Mortgage Type
VA
Purchase Details
Closed on
Jul 21, 2000
Sold by
Kfp Corp
Bought by
Dream Livin Custom Homes
Create a Home Valuation Report for This Property
The Home Valuation Report is an in-depth analysis detailing your home's value as well as a comparison with similar homes in the area
Home Values in the Area
Average Home Value in this Area
Purchase History
| Date | Buyer | Sale Price | Title Company |
|---|---|---|---|
| Foote Christopher L | -- | Title One | |
| Foote Christopher L | -- | Merrill Title | |
| Dream Livin Custom Homes | -- | Mt Olympus Title |
Source: Public Records
Mortgage History
| Date | Status | Borrower | Loan Amount |
|---|---|---|---|
| Open | Foote Christopher L | $248,000 | |
| Closed | Foote Christopher L | $209,100 |
Source: Public Records
Tax History Compared to Growth
Tax History
| Year | Tax Paid | Tax Assessment Tax Assessment Total Assessment is a certain percentage of the fair market value that is determined by local assessors to be the total taxable value of land and additions on the property. | Land | Improvement |
|---|---|---|---|---|
| 2025 | $2,856 | $555,200 | $152,600 | $402,600 |
| 2024 | $2,856 | $549,400 | $146,700 | $402,700 |
| 2023 | $2,856 | $503,400 | $148,500 | $354,900 |
| 2022 | $2,899 | $517,100 | $145,600 | $371,500 |
| 2021 | $2,557 | $415,300 | $112,000 | $303,300 |
| 2020 | $2,430 | $370,400 | $103,000 | $267,400 |
| 2019 | $2,400 | $358,700 | $97,200 | $261,500 |
| 2018 | $2,215 | $328,300 | $97,200 | $231,100 |
| 2017 | $2,143 | $316,200 | $97,200 | $219,000 |
| 2016 | $1,926 | $267,100 | $102,100 | $165,000 |
| 2015 | $1,934 | $261,500 | $109,300 | $152,200 |
| 2014 | $1,886 | $251,000 | $105,800 | $145,200 |
Source: Public Records
Map
Nearby Homes
- 7563 S Opal Mountain Way W Unit 306
- 7567 S Opal Mountain Way W Unit 307
- 7556 S Opal Mountain Way W Unit 311
- 7569 S Opal Mountain Way W Unit 308
- 7554 S Opal Mountain Way W Unit 310
- 7553 S Opal Mountain Way W Unit 302
- 7414 Regal Hill Dr
- 6880 S Survey Peak Ln
- 6884 S Survey Peak Ln
- 6888 S Survey Peak Ln
- 7288 Comet Hill Cir
- 7502 S Lace Wood Dr Unit 417
- 7493 S Lace Wood Dr
- 5151 Case Mountain Rd
- 7882 S Dove Creek Ln Unit A6
- 7908 Cold Stone Ln Unit N3
- 5189 W Dove Creek Ln
- 5208 W Case Mountain Rd
- 5228 W Ranches Loop Rd
- 5183 W Swift Water Way
- 7512 S 5040 W
- 7542 S 5040 W
- 7527 S 5040 W
- 7515 S 5040 W
- 7498 S 5040 W
- 7554 S 5040 W
- 7543 S 5040 W
- 7501 S 5040 W
- 7551 S Wood Mesa Dr
- 7551 Wood Mesa Dr
- 7555 S 5040 W
- 7522 Woodbend Rd
- 7486 S 5040 W
- 7568 S 5040 W
- 7508 Woodbend Rd
- 7489 S 5040 W
- 7536 Woodbend Rd
- 7561 Wood Mesa Dr
- 7561 S Wood Mesa Dr
- 7496 S Woodbend Rd