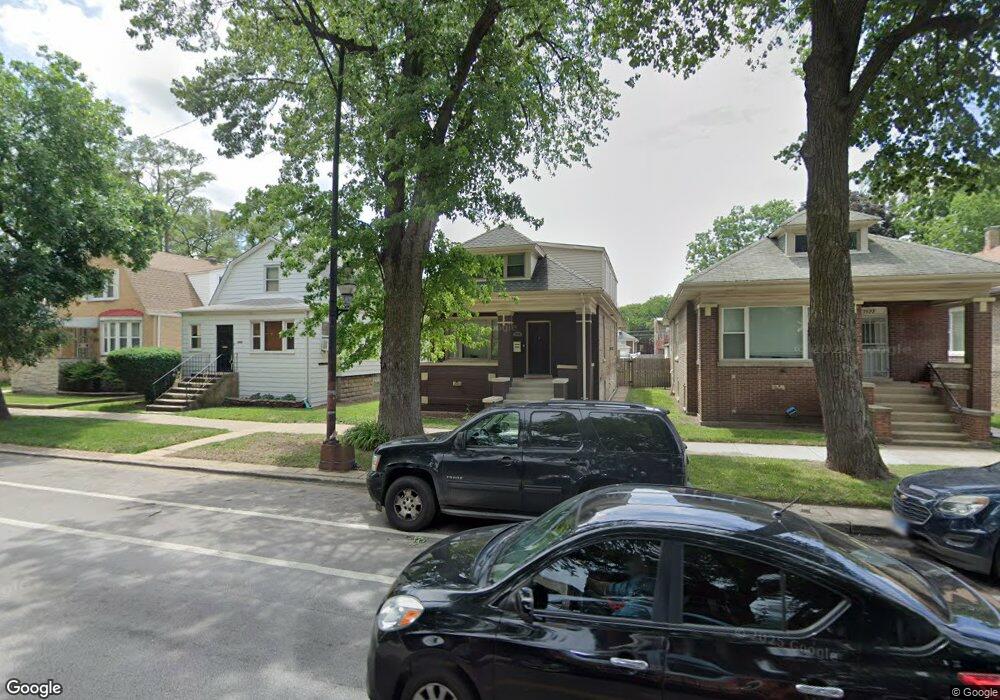
7526 S King Dr Chicago, IL 60619
Park Manor NeighborhoodEstimated Value: $188,000 - $362,000
4
Beds
3
Baths
2,900
Sq Ft
$91/Sq Ft
Est. Value
About This Home
This home is located at 7526 S King Dr, Chicago, IL 60619 and is currently estimated at $264,347, approximately $91 per square foot. 7526 S King Dr is a home located in Cook County with nearby schools including Ruggles Elementary School, Rescue Missionary Christian School, and Augustus Tolton Catholic Academy.
Ownership History
Date
Name
Owned For
Owner Type
Purchase Details
Closed on
May 5, 2011
Sold by
Robert Sheridan & Partners Llc
Bought by
Beck Keith
Current Estimated Value
Home Financials for this Owner
Home Financials are based on the most recent Mortgage that was taken out on this home.
Original Mortgage
$175,437
Outstanding Balance
$121,527
Interest Rate
4.81%
Mortgage Type
FHA
Estimated Equity
$142,820
Purchase Details
Closed on
Mar 16, 2010
Sold by
Artanis Corporation
Bought by
Robert Sheridan & Partners Llc
Purchase Details
Closed on
Jul 15, 2009
Sold by
Glohry Llc
Bought by
Artanis Corporation
Purchase Details
Closed on
May 22, 2009
Sold by
Orr David D
Bought by
Glohry Llc
Purchase Details
Closed on
Oct 31, 2000
Sold by
Davis Adeline C
Bought by
Hardrick Mary L
Home Financials for this Owner
Home Financials are based on the most recent Mortgage that was taken out on this home.
Original Mortgage
$37,000
Interest Rate
7.87%
Create a Home Valuation Report for This Property
The Home Valuation Report is an in-depth analysis detailing your home's value as well as a comparison with similar homes in the area
Home Values in the Area
Average Home Value in this Area
Purchase History
| Date | Buyer | Sale Price | Title Company |
|---|---|---|---|
| Beck Keith | $180,000 | Cti | |
| Robert Sheridan & Partners Llc | $42,000 | Stewart Title Company | |
| Artanis Corporation | $35,000 | Git | |
| Glohry Llc | -- | None Available | |
| Hardrick Mary L | $77,000 | -- |
Source: Public Records
Mortgage History
| Date | Status | Borrower | Loan Amount |
|---|---|---|---|
| Open | Beck Keith | $175,437 | |
| Previous Owner | Hardrick Mary L | $37,000 |
Source: Public Records
Tax History Compared to Growth
Tax History
| Year | Tax Paid | Tax Assessment Tax Assessment Total Assessment is a certain percentage of the fair market value that is determined by local assessors to be the total taxable value of land and additions on the property. | Land | Improvement |
|---|---|---|---|---|
| 2024 | $2,043 | $15,000 | $4,380 | $10,620 |
| 2023 | $1,970 | $13,000 | $5,840 | $7,160 |
| 2022 | $1,970 | $13,000 | $5,840 | $7,160 |
| 2021 | $2,614 | $13,000 | $5,840 | $7,160 |
| 2020 | $2,797 | $12,556 | $4,672 | $7,884 |
| 2019 | $2,772 | $13,798 | $4,672 | $9,126 |
| 2018 | $2,726 | $13,798 | $4,672 | $9,126 |
| 2017 | $3,574 | $16,602 | $4,088 | $12,514 |
| 2016 | $3,325 | $16,602 | $4,088 | $12,514 |
| 2015 | $3,042 | $16,602 | $4,088 | $12,514 |
| 2014 | $2,797 | $15,077 | $3,504 | $11,573 |
| 2013 | $2,742 | $15,077 | $3,504 | $11,573 |
Source: Public Records
Map
Nearby Homes
- 7430 S King Dr
- 7616 S Calumet Ave
- 7535 S Vernon Ave
- 7627 S Prairie Ave
- 7449 S Vernon Ave
- 7425 S Vernon Ave
- 7533 S Eberhart Ave
- 7353 S Doctor Martin Luther King Junior Dr
- 7514 S Rhodes Ave
- 7428 S Rhodes Ave
- 7720 S Prairie Ave
- 7635 S Michigan Ave
- 7532 S Saint Lawrence Ave
- 7253 S Prairie Ave
- 7537 S Saint Lawrence Ave
- 7741 S Indiana Ave
- 7443 S Wabash Ave
- 7736 S Indiana Ave
- 7619 S Wabash Ave
- 7512 S Champlain Ave
- 7530 S King Dr
- 7532 S King Dr
- 7518 S King Dr
- 7514 S King Dr
- 7538 S King Dr
- 7540 S King Dr
- 7527 S Calumet Ave
- 7544 S King Dr
- 7531 S Calumet Ave
- 7517 S Calumet Ave
- 7535 S Calumet Ave
- 7523 S King Dr Unit 2
- 7523 S King Dr
- 7515 S Calumet Ave
- 7539 S Calumet Ave
- 367 E 75th St
- 7548 S King Dr
- 7525 S Calumet Ave