7528 Plymouth Way Rancho Cucamonga, CA 91730
Terra Vista NeighborhoodEstimated Value: $741,000 - $866,000
4
Beds
3
Baths
2,204
Sq Ft
$366/Sq Ft
Est. Value
About This Home
This home is located at 7528 Plymouth Way, Rancho Cucamonga, CA 91730 and is currently estimated at $806,563, approximately $365 per square foot. 7528 Plymouth Way is a home located in San Bernardino County with nearby schools including Ruth Musser Middle, Coyote Canyon Elementary, and Rancho Cucamonga High School.
Ownership History
Date
Name
Owned For
Owner Type
Purchase Details
Closed on
May 23, 2017
Sold by
Migliacci Michael C
Bought by
Migliacci Michael C and Sepulveda Migliacci Marie
Current Estimated Value
Purchase Details
Closed on
Dec 1, 1998
Sold by
Li Huan Ping and Wang Xia
Bought by
Migliacci Michael C and Migliacci Marie
Home Financials for this Owner
Home Financials are based on the most recent Mortgage that was taken out on this home.
Original Mortgage
$187,650
Outstanding Balance
$42,183
Interest Rate
6.66%
Mortgage Type
VA
Estimated Equity
$764,380
Purchase Details
Closed on
Jan 10, 1994
Sold by
Myers Dean A
Bought by
Li Huan Ping and Wang Xia
Home Financials for this Owner
Home Financials are based on the most recent Mortgage that was taken out on this home.
Original Mortgage
$154,000
Interest Rate
7.09%
Create a Home Valuation Report for This Property
The Home Valuation Report is an in-depth analysis detailing your home's value as well as a comparison with similar homes in the area
Home Values in the Area
Average Home Value in this Area
Purchase History
| Date | Buyer | Sale Price | Title Company |
|---|---|---|---|
| Migliacci Michael C | -- | None Available | |
| Migliacci Michael C | $184,000 | First American Title Ins Co | |
| Li Huan Ping | $163,000 | Orange Coast Title |
Source: Public Records
Mortgage History
| Date | Status | Borrower | Loan Amount |
|---|---|---|---|
| Open | Migliacci Michael C | $187,650 | |
| Previous Owner | Li Huan Ping | $154,000 |
Source: Public Records
Tax History Compared to Growth
Tax History
| Year | Tax Paid | Tax Assessment Tax Assessment Total Assessment is a certain percentage of the fair market value that is determined by local assessors to be the total taxable value of land and additions on the property. | Land | Improvement |
|---|---|---|---|---|
| 2025 | $4,384 | $352,323 | $72,114 | $280,209 |
| 2024 | $4,384 | $345,415 | $70,700 | $274,715 |
| 2023 | $4,269 | $338,642 | $69,314 | $269,328 |
| 2022 | $4,179 | $332,002 | $67,955 | $264,047 |
| 2021 | $4,177 | $325,493 | $66,623 | $258,870 |
| 2020 | $4,074 | $322,156 | $65,940 | $256,216 |
| 2019 | $4,055 | $315,839 | $64,647 | $251,192 |
| 2018 | $3,956 | $309,646 | $63,379 | $246,267 |
| 2017 | $3,894 | $303,574 | $62,136 | $241,438 |
| 2016 | $3,874 | $297,622 | $60,918 | $236,704 |
| 2015 | $3,828 | $293,151 | $60,003 | $233,148 |
| 2014 | $3,723 | $287,409 | $58,828 | $228,581 |
Source: Public Records
Map
Nearby Homes
- 7688 Gainey Ct
- 7685 Haven Ave Unit E
- 10669 Wildrose Dr
- 10627 Wildrose Dr
- 7718 Haywood Place
- 7355 Ambrosia Rd
- 7803 Paxton Place
- 7314 Greenhaven Ave Unit 74
- 10591 Huxley Dr
- 10375 Church St Unit 113
- 10375 Church St Unit 74
- 7224 Parkside Place
- 7346 Springmill Place
- 7759 Devonshire Ct
- 7175 Summerfield Place
- 7208 Marine Ave
- 10350 Base Line Rd
- 10350 Base Line Rd Unit 192
- 10350 Baseline Rd Unit 173
- 11090 Mountain View Dr Unit 53
- 7522 Plymouth Way
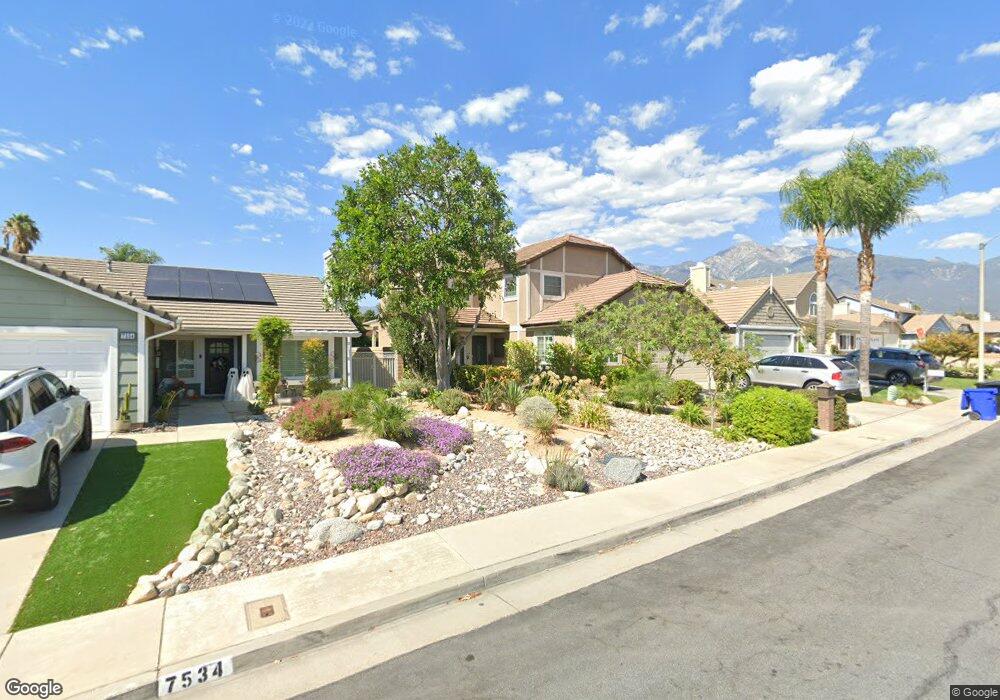
- 7534 Plymouth Way
- 7514 Plymouth Way
- 7542 Plymouth Way
- 7506 Plymouth Way
- 7548 Plymouth Way
- 7535 Plymouth Way
- 7529 Plymouth Way
- 7521 Plymouth Way
- 10687 Essex Place
- 7500 Plymouth Way
- 7513 Plymouth Way
- 7554 Plymouth Way
- 7499 Brookside Rd
- 7503 Brookside Rd
- 10695 Essex Place
- 7509 Brookside Rd
- 7489 Brookside Rd
- 7505 Plymouth Way
- 7492 Plymouth Way