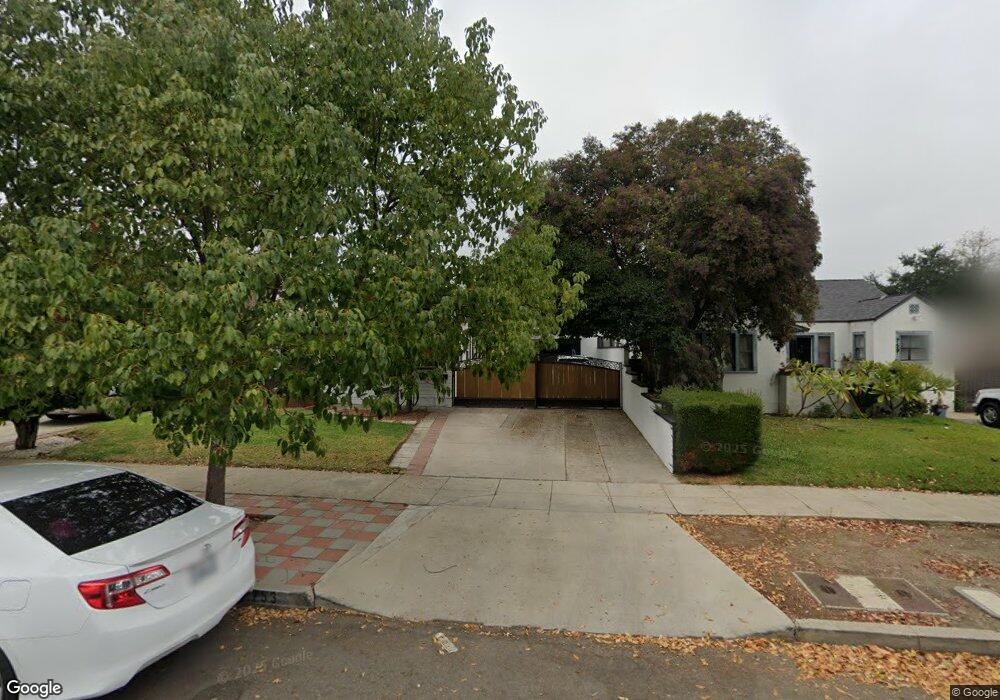
753 E H St Ontario, CA 91764
Downtown Ontario NeighborhoodEstimated Value: $514,623 - $647,000
1
Bed
1
Bath
660
Sq Ft
$873/Sq Ft
Est. Value
About This Home
This home is located at 753 E H St, Ontario, CA 91764 and is currently estimated at $576,156, approximately $872 per square foot. 753 E H St is a home located in San Bernardino County with nearby schools including Berlyn Elementary, Vina Danks Middle, and Chaffey High School.
Ownership History
Date
Name
Owned For
Owner Type
Purchase Details
Closed on
Apr 22, 2002
Sold by
Story Jeff
Bought by
Acosta Fernando and Acosta Joel
Current Estimated Value
Home Financials for this Owner
Home Financials are based on the most recent Mortgage that was taken out on this home.
Original Mortgage
$177,493
Outstanding Balance
$73,999
Interest Rate
6.89%
Mortgage Type
FHA
Estimated Equity
$502,157
Purchase Details
Closed on
May 10, 2001
Sold by
Story Carol A
Bought by
The 753 H St A & B Title Trust
Purchase Details
Closed on
Nov 10, 1999
Sold by
Horvath Sandra L
Bought by
Story Carol A
Purchase Details
Closed on
Jul 7, 1994
Sold by
Brown Herman F
Bought by
Brown Herman F
Create a Home Valuation Report for This Property
The Home Valuation Report is an in-depth analysis detailing your home's value as well as a comparison with similar homes in the area
Home Values in the Area
Average Home Value in this Area
Purchase History
We collect this data history from publicly available records. To have your information removed, we recommend requesting removal directly through your county’s website.
| Date | Buyer | Sale Price | Title Company |
|---|---|---|---|
| Acosta Fernando | $180,000 | Stewart Title | |
| The 753 H St A & B Title Trust | -- | -- | |
| Story Carol A | $100,000 | Chicago Title Co | |
| Brown Herman F | -- | -- |
Source: Public Records
Mortgage History
We collect this data history from publicly available records. To have your information removed, we recommend requesting removal directly through your county’s website.
| Date | Status | Borrower | Loan Amount |
|---|---|---|---|
| Open | Acosta Fernando | $177,493 |
Source: Public Records
Tax History
| Year | Tax Paid | Tax Assessment Tax Assessment Total Assessment is a certain percentage of the fair market value that is determined by local assessors to be the total taxable value of land and additions on the property. | Land | Improvement |
|---|---|---|---|---|
| 2025 | $2,935 | $265,918 | $93,072 | $172,846 |
| 2024 | $2,868 | $260,704 | $91,247 | $169,457 |
| 2023 | $2,787 | $255,592 | $89,458 | $166,134 |
| 2022 | $2,751 | $250,580 | $87,704 | $162,876 |
| 2021 | $2,734 | $245,666 | $85,984 | $159,682 |
| 2020 | $2,686 | $243,147 | $85,102 | $158,045 |
| 2019 | $2,663 | $238,379 | $83,433 | $154,946 |
| 2018 | $2,572 | $228,868 | $80,625 | $148,243 |
| 2017 | $2,354 | $212,900 | $75,000 | $137,900 |
| 2016 | $2,197 | $202,700 | $71,400 | $131,300 |
| 2015 | $2,110 | $193,000 | $68,000 | $125,000 |
| 2014 | $2,085 | $193,000 | $68,000 | $125,000 |
Source: Public Records
Map
Nearby Homes
Your Personal Tour Guide
Ask me questions while you tour the home.