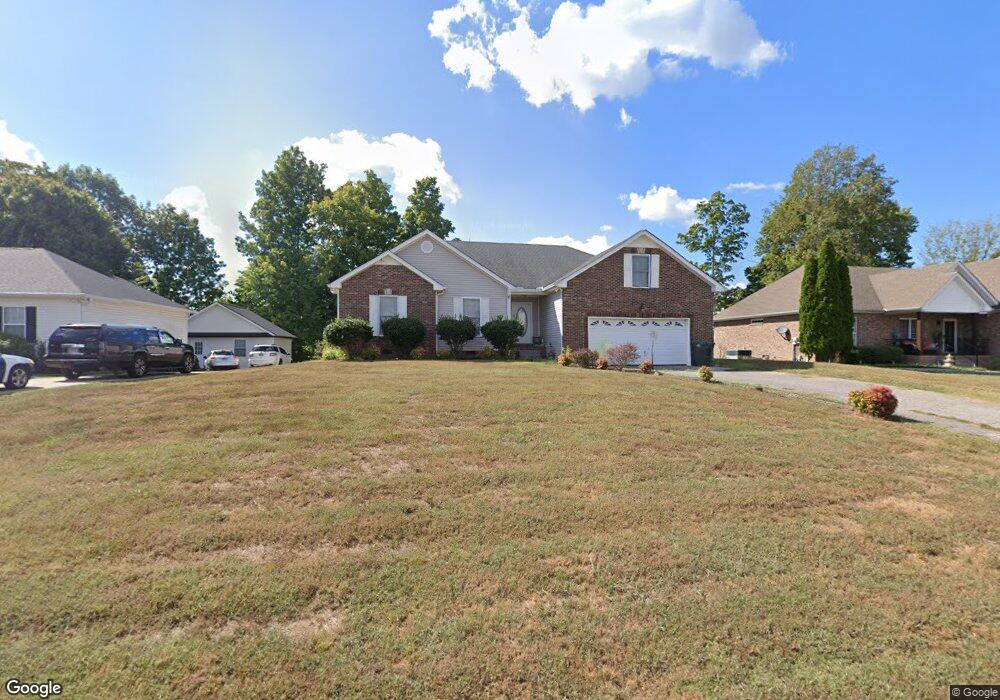
753 Hunters Crossing Ln Springfield, TN 37172
Estimated Value: $323,000 - $400,000
--
Bed
2
Baths
1,697
Sq Ft
$212/Sq Ft
Est. Value
About This Home
This home is located at 753 Hunters Crossing Ln, Springfield, TN 37172 and is currently estimated at $360,163, approximately $212 per square foot. 753 Hunters Crossing Ln is a home located in Robertson County with nearby schools including Crestview Elementary School, Innovation Academy, and Springfield High School.
Ownership History
Date
Name
Owned For
Owner Type
Purchase Details
Closed on
Nov 30, 2010
Sold by
Seeley Dianne M 401K Profi
Bought by
Wynn Vincent A
Current Estimated Value
Home Financials for this Owner
Home Financials are based on the most recent Mortgage that was taken out on this home.
Original Mortgage
$162,400
Outstanding Balance
$107,839
Interest Rate
4.32%
Estimated Equity
$252,324
Purchase Details
Closed on
Jul 16, 2010
Sold by
Young David L
Bought by
Seeley Dianne M 401K Profit Sh
Purchase Details
Closed on
May 20, 2010
Sold by
Carn Marc T
Bought by
Young David L
Purchase Details
Closed on
Sep 2, 2005
Sold by
M & M Construction Inc
Bought by
Carn Marc T
Home Financials for this Owner
Home Financials are based on the most recent Mortgage that was taken out on this home.
Original Mortgage
$127,200
Interest Rate
5.77%
Purchase Details
Closed on
Nov 5, 2004
Bought by
M & M Construction Inc
Create a Home Valuation Report for This Property
The Home Valuation Report is an in-depth analysis detailing your home's value as well as a comparison with similar homes in the area
Home Values in the Area
Average Home Value in this Area
Purchase History
| Date | Buyer | Sale Price | Title Company |
|---|---|---|---|
| Wynn Vincent A | $162,400 | -- | |
| Seeley Dianne M 401K Profit Sh | $135,000 | -- | |
| Young David L | $112,424 | -- | |
| Carn Marc T | $159,000 | -- | |
| M & M Construction Inc | $23,000 | -- |
Source: Public Records
Mortgage History
| Date | Status | Borrower | Loan Amount |
|---|---|---|---|
| Open | Wynn Vincent A | $162,400 | |
| Previous Owner | M & M Construction Inc | $127,200 |
Source: Public Records
Tax History Compared to Growth
Tax History
| Year | Tax Paid | Tax Assessment Tax Assessment Total Assessment is a certain percentage of the fair market value that is determined by local assessors to be the total taxable value of land and additions on the property. | Land | Improvement |
|---|---|---|---|---|
| 2024 | -- | $78,275 | $22,500 | $55,775 |
| 2023 | $1,961 | $78,275 | $22,500 | $55,775 |
| 2022 | $1,760 | $48,250 | $6,875 | $41,375 |
| 2021 | $1,760 | $48,250 | $6,875 | $41,375 |
| 2020 | $1,760 | $48,250 | $6,875 | $41,375 |
| 2019 | $52,943 | $48,250 | $6,875 | $41,375 |
| 2018 | $1,760 | $48,250 | $6,875 | $41,375 |
| 2017 | $1,854 | $43,275 | $6,350 | $36,925 |
| 2016 | $1,854 | $43,275 | $6,350 | $36,925 |
| 2015 | $1,800 | $43,275 | $6,350 | $36,925 |
| 2014 | $1,800 | $43,275 | $6,350 | $36,925 |
Source: Public Records
Map
Nearby Homes
- 966 Hunters Ln
- 962 Hunters Ln
- 965 Hunters Ln
- 958 Hunters Ln
- 954 Hunters Ln
- 950 Hunters Ln
- 946 Hunters Ln
- 942 Hunters Ln
- 938 Hunters Ln
- 509 Gunn Ln
- 812 Hunters Crossing Ln
- 401 Lakeside Dr
- 809 Hillside Dr
- 793 Spring Cir
- 836 Savannah Ct W
- 1 Tom Austin Hwy
- 1073 Rector Ln
- 329 Cayce Dr
- 3606 Oakland Rd
- 6210 Green Rd
- 749 Hunters Crossing Ln
- 757 Hunters Crossing Ln
- 761 Hunters Crossing Ln
- 745 Hunters Crossing Ln
- 756 Hunters Crossing Ln
- 752 Hunters Crossing Ln
- 741 Hunters Crossing Ln
- 765 Hunters Crossing Ln
- 760 Hunters Crossing Ln
- 748 Hunters Crossing Ln
- 764 Hunters Crossing Ln
- 744 Hunters Crossing Ln
- 0 Treeline Ct
- 703 Red Hollow Dr
- 701 Red Hollow Dr
- 768 Hunters Crossing Ln
- 705 Red Hollow Dr
- 699 Red Hollow Dr
- 983 Hunters Ln
- 707 Red Hollow Dr